Close Menu
    What's Hot

    Altseason is coming, 40% daily gains to become ‘new normal’ — Analyst

    Coinbase considered Saylor-like Bitcoin strategy before opting out: Bloomberg

    Polkadot’s $5.30 resistance looms – Factors that will decide DOT’s fate

    Facebook X (Twitter) Instagram
    MarketsNews.co.uk
    • Live Chart
    • Brokers
    • Scam Broker
    • Reviews
    • Tools
      • Lot Size Calculator
      • Margin Calculator
      • PIPS Calculator
      • Profit & loss calculator
    Facebook X (Twitter) Instagram
    Start Trading
    Trending Topics:
    • Markets
    • Stocks
    • Cryptocurrency
    • Forex
    • Scam Broker
    MarketsNews.co.uk
    • Markets
    • Stocks
    • Cryptocurrency
    • Forex
    • Scam Broker
    Cryptocurrency

    Will it break $13 resistance for a 40% surge?

    Anthony M. OrbisonBy Anthony M. OrbisonOctober 27, 2024No Comments3 Mins Read
    Share Facebook Twitter Pinterest Copy Link Telegram LinkedIn Tumblr Email
    Share
    Facebook Twitter LinkedIn Pinterest Email
    •  Chainlink shows potential for a 40% rally, but breaking $13 resistance is crucial for the move.
    • Large transactions spike while on-chain metrics reveal sustained accumulation of LINK over the past month.

    Chainlink [LINK] was trading at $11.09 at press time, experiencing a 6.16% decline over the past 24 hours. The token has a circulating supply of 630 million LINK, giving it a market cap of approximately $6.95 billion. 

    Trading volume in the last 24 hours reached $594.2 million, indicating active trading despite the recent price drop.

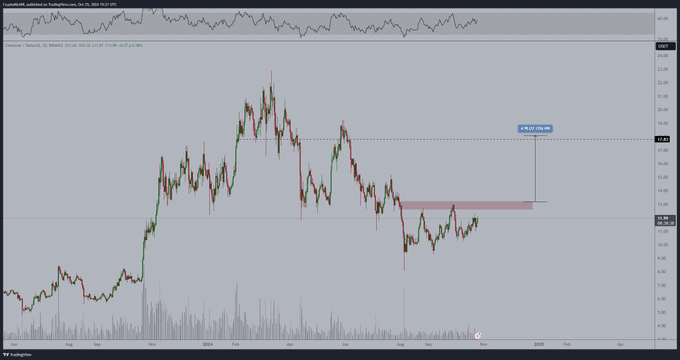
    The current price movement comes after a period of consolidation in the $11-$12 range, following a downtrend. Analysts are closely watching the $13 resistance level, as it has repeatedly served as a key barrier. A break above this level could signal a bullish trend shift.

    Potential breakout and key resistance

    Michaël van de Poppe, a crypto analyst, maintains a bullish outlook on Chainlink. He expects a breakout within the next two weeks if LINK can overcome the $13 resistance. He describes this level as,  

    “the key to trigger further upward movement.”

    Source: X

    If LINK successfully breaks above $13, the price could potentially rally toward the $18 level, representing around a 40% gain from the breakout point. The Relative Strength Index (RSI) is currently in neutral territory, suggesting there is room for upward movement. 

    On-chain metrics: Large transactions surge

    In the past 24 hours, 192 large transactions were recorded on the Chainlink network, matching the 7-day high reached on 25th October. This marks an increase from the 7-day low of 54 transactions on 19th October. 

    Source: IntoTheBlock

    The surge in large transactions suggests heightened interest or significant capital movement among major holders.

    In addition, the In/Out of the Money analysis shows that 37.51% of addresses (262.38k) are “in the money,” having purchased LINK at prices below $11.08. Meanwhile, 58.90% of addresses (411.97k) are “out of the money,” indicating they bought at higher prices. 

    Source: IntoTheBlock

    This could create stronger resistance if prices approach the $11.81-$13.17 range.

    Exchange inflows and outflows

    IntoTheBlock data from the past 24 hours reveals a net inflow of +105.43k LINK to exchanges, indicating potential short-term selling pressure. However, over the past week, a net outflow of -181.08k LINK suggests broader accumulation by holders. 

    Looking at the 30-day change, there has been a net outflow of -662.22k LINK, signaling sustained long-term accumulation trends.

    Source: IntoTheBlock


    Is your portfolio green? Check out the LINK Profit Calculator


    These inflow and outflow patterns point to possible short-term selling within a broader context of long-term accumulation.

    The recent increase in exchange inflows could be a temporary reaction, while the larger outflows over the past month reflect confidence in LINK’s longer-term prospects.

    Next: Ethereum exchange inflows spike: Will U.S. elections spark a bounce?

    Source link

    Share. Facebook Twitter Pinterest LinkedIn Tumblr Email Copy Link
    Previous ArticleInside the Sicilian ice cream empire built on mafia money
    Next Article Disney Cruise Line preparing for magical holiday season kickoff
    Anthony M. Orbison
    • Website

    Related Posts

    Altseason is coming, 40% daily gains to become ‘new normal’ — Analyst

    May 11, 2025

    Coinbase considered Saylor-like Bitcoin strategy before opting out: Bloomberg

    May 11, 2025

    Polkadot’s $5.30 resistance looms – Factors that will decide DOT’s fate

    May 11, 2025
    Leave A Reply Cancel Reply

    Amazon.com, Inc.
    $193.06
    $0.98
    0.51%
    Meta Platforms, Inc.
    $592.49
    $5.52
    0.92%
    S&P 500
    $5,659.91
    $4.03
    0.07%
    Alphabet Inc.
    $154.38
    $1.37
    0.88%
    EUR/USD
    $1.12
    $0.002
    0.18%
    EUR/JPY
    $163.52
    $0.192
    0.12%
    USD/CAD
    $1.39
    $0.0013
    0.09%

    Risk Disclosure: Trading in financial instruments and/or cryptocurrencies involves high risks including the risk of losing some, or all, of your investment amount, and may not be suitable for all investors. Prices of cryptocurrencies are extremely volatile and may be affected by external factors such as financial, regulatory or political events. Trading on margin increases the financial risks.
    Before deciding to trade in financial instrument or cryptocurrencies you should be fully informed of the risks and costs associated with trading the financial markets, carefully consider your investment objectives, level of experience, and risk appetite, and seek professional advice where needed.
    Fusion Media would like to remind you that the data contained in this website is not necessarily real-time nor accurate. The data and prices on the website are not necessarily provided by any market or exchange, but may be provided by market makers, and so prices may not be accurate and may differ from the actual price at any given market, meaning prices are indicative and not appropriate for trading purposes. Fusion Media and any provider of the data contained in this website will not accept liability for any loss or damage as a result of your trading, or your reliance on the information contained within this website.
    It is prohibited to use, store, reproduce, display, modify, transmit or distribute the data contained in this website without the explicit prior written permission of Fusion Media and/or the data provider. All intellectual property rights are reserved by the providers and/or the exchange providing the data contained in this website.
    Fusion Media may be compensated by the advertisers that appear on the website, based on your interaction with the advertisements or advertisers.
    We're social. Connect with us:

    Facebook X (Twitter)
    • Home
    • About us
    • Contact
    • Disclaimer
    • Privacy Policy
    © 2025 Marketsnews.co.uk

    Type above and press Enter to search. Press Esc to cancel.