Close Menu
    What's Hot

    Ethereum Holds Above $1900 Realized Price Signalling Long-Term Bullish Confidence

    Solana Rallies Into Pivotal Zone – $180 Level Could Define Next Move

    El Salvador stacks 7 Bitcoin in last week, despite IMF deal

    Facebook X (Twitter) Instagram
    MarketsNews.co.uk
    • Live Chart
    • Brokers
    • Scam Broker
    • Reviews
    • Tools
      • Lot Size Calculator
      • Margin Calculator
      • PIPS Calculator
      • Profit & loss calculator
    Facebook X (Twitter) Instagram
    Start Trading
    Trending Topics:
    • Markets
    • Stocks
    • Cryptocurrency
    • Forex
    • Scam Broker
    MarketsNews.co.uk
    • Markets
    • Stocks
    • Cryptocurrency
    • Forex
    • Scam Broker
    Cryptocurrency

    Solana Bullish Pattern Holds – Crypto Analyst Sets $202 Target

    Anthony M. OrbisonBy Anthony M. OrbisonOctober 27, 2024No Comments3 Mins Read
    Share Facebook Twitter Pinterest Copy Link Telegram LinkedIn Tumblr Email
    Share
    Facebook Twitter LinkedIn Pinterest Email

    Solana is showing strength as it pushes above the critical $171 level—a price that previously acted as supply and now serves as a solid demand zone. This level is relevant for bulls, as holding above could pave the way for a rally in the coming weeks.

    Crypto analyst and investor Carl Runefelt recently shared a technical analysis indicating that Solana’s current price action remains bullish as long as it sustains support above this mark. 

    Related Reading

    Solana’s ability to turn former resistance into a support base reflects increased demand, which could act as a catalyst for further upward momentum. The market is closely monitoring these movements, and the next few days are expected to be crucial for Solana.

    If SOL maintains its trajectory above $171, it may spark optimism for an extended uptrend. Investors will likely keep a close eye on Solana’s price dynamics, as any shift below this level could alter the short-term outlook for one of crypto’s most promising assets.

    Solana Testing Liquidity

    Top investor Carl Runefelt recently shared his insights on X, highlighting the significance of Solana’s head and shoulders pattern. In his analysis, Runefelt noted that a successful neckline retest would confirm the bullish trend’s strength. 

    Solana retesting the head and shoulders pattern | Source: Carl Runefelt on X

    Runefelt’s chart analysis further indicates that as long as SOL remains above the neckline, bullish momentum is expected to persist, with his target price set at $202 in the short term.

    This potential upward movement has caught the attention of both investors and traders who are looking at the $202 level as an achievable target if the current bullish trend continues. Runefelt’s analysis underscores that the neckline acts as a critical support level—one that, if maintained, could drive strong buying interest. However, any break below this neckline could shift the momentum, potentially leading to a more cautious outlook.

    Related Reading

    With the head and shoulders structure forming, Solana’s price action will be crucial in the next few days. A successful retest of the neckline could fuel continued growth, possibly pushing SOL to new highs.

    SOL Price Action

    Solana (SOL) is trading at $172, steadily climbing as it targets a higher supply zone. To maintain this bullish momentum, SOL bulls need to push the price above the critical $180 resistance level. This $180 mark acts as a key resistance, and breaking it could potentially trigger a wave of FOMO (fear of missing out) buying, which would drive the price even higher. This psychological level may attract increased interest from traders who see a clear breakout as a signal for more gains.
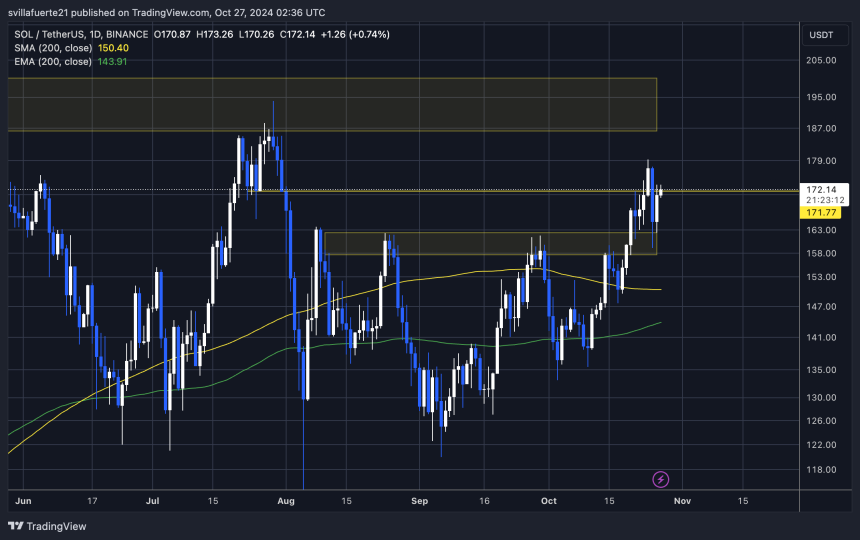
    SOL holding above the key $171 mark
    SOL holding above the key $171 mark | Source: SOLUSDT chart on TradingView

    However, maintaining this bullish trend is essential. If SOL cannot maintain support above $171, a retracement to lower demand zones is likely. This move could bring SOL back to test support levels closer to previous lows, possibly slowing down the current momentum.

    Related Reading

    For traders and investors watching closely, the next moves around the $171 and $180 levels are key indicators. A strong push past $180 could suggest continued strength in Solana’s price action. A drop below $171 would signal weakness, indicating a temporary pause or pullback in the recent rally.

    Featured image from Dall-E, chart from TradingView
    Source link

    Share. Facebook Twitter Pinterest LinkedIn Tumblr Email Copy Link
    Previous ArticleGeorgia’s opposition calls for protests after pro-Russian party declared winner
    Next Article What a soft landing means for the momentum trade By Investing.com
    Anthony M. Orbison
    • Website

    Related Posts

    Ethereum Holds Above $1900 Realized Price Signalling Long-Term Bullish Confidence

    May 11, 2025

    Solana Rallies Into Pivotal Zone – $180 Level Could Define Next Move

    May 11, 2025

    El Salvador stacks 7 Bitcoin in last week, despite IMF deal

    May 11, 2025
    Leave A Reply Cancel Reply

    Amazon.com, Inc.
    $193.06
    $0.98
    0.51%
    Meta Platforms, Inc.
    $592.49
    $5.52
    0.92%
    S&P 500
    $5,659.91
    $4.03
    0.07%
    Alphabet Inc.
    $154.38
    $1.37
    0.88%
    EUR/USD
    $1.12
    $0.002
    0.18%
    EUR/JPY
    $163.52
    $0.192
    0.12%
    USD/CAD
    $1.39
    $0.0013
    0.09%

    Risk Disclosure: Trading in financial instruments and/or cryptocurrencies involves high risks including the risk of losing some, or all, of your investment amount, and may not be suitable for all investors. Prices of cryptocurrencies are extremely volatile and may be affected by external factors such as financial, regulatory or political events. Trading on margin increases the financial risks.
    Before deciding to trade in financial instrument or cryptocurrencies you should be fully informed of the risks and costs associated with trading the financial markets, carefully consider your investment objectives, level of experience, and risk appetite, and seek professional advice where needed.
    Fusion Media would like to remind you that the data contained in this website is not necessarily real-time nor accurate. The data and prices on the website are not necessarily provided by any market or exchange, but may be provided by market makers, and so prices may not be accurate and may differ from the actual price at any given market, meaning prices are indicative and not appropriate for trading purposes. Fusion Media and any provider of the data contained in this website will not accept liability for any loss or damage as a result of your trading, or your reliance on the information contained within this website.
    It is prohibited to use, store, reproduce, display, modify, transmit or distribute the data contained in this website without the explicit prior written permission of Fusion Media and/or the data provider. All intellectual property rights are reserved by the providers and/or the exchange providing the data contained in this website.
    Fusion Media may be compensated by the advertisers that appear on the website, based on your interaction with the advertisements or advertisers.
    We're social. Connect with us:

    Facebook X (Twitter)
    • Home
    • About us
    • Contact
    • Disclaimer
    • Privacy Policy
    © 2025 Marketsnews.co.uk

    Type above and press Enter to search. Press Esc to cancel.