Close Menu
    What's Hot

    El Salvador stacks 7 Bitcoin in last week, despite IMF deal

    Ex-UFC champ Conor McGregor touts Irish Bitcoin reserve in presidential bid

    Altseason is coming, 40% daily gains to become ‘new normal’ — Analyst

    Facebook X (Twitter) Instagram
    MarketsNews.co.uk
    • Live Chart
    • Brokers
    • Scam Broker
    • Reviews
    • Tools
      • Lot Size Calculator
      • Margin Calculator
      • PIPS Calculator
      • Profit & loss calculator
    Facebook X (Twitter) Instagram
    Start Trading
    Trending Topics:
    • Markets
    • Stocks
    • Cryptocurrency
    • Forex
    • Scam Broker
    MarketsNews.co.uk
    • Markets
    • Stocks
    • Cryptocurrency
    • Forex
    • Scam Broker
    Cryptocurrency

    Mixed signals in DOT market: What’s next for Polkadot prices?

    Anthony M. OrbisonBy Anthony M. OrbisonOctober 27, 2024No Comments3 Mins Read
    Share Facebook Twitter Pinterest Copy Link Telegram LinkedIn Tumblr Email
    Share
    Facebook Twitter LinkedIn Pinterest Email
    • DOT’s price faces a key threshold; if it can break through the current supply level, a rally could follow.
    • Technical indicators are sending mixed signals—some suggest a bullish shift, while others hint at continued bearish pressure.

    Over the past month, Polkadot’s [DOT] performance has been lackluster, with a dominant bearish sentiment leading to an 18.97% decline.

    The next move for DOT remains uncertain as conflicting metrics keep market sentiment divided, leaving room for volatility across upcoming trading sessions.

    DOT stuck between key levels

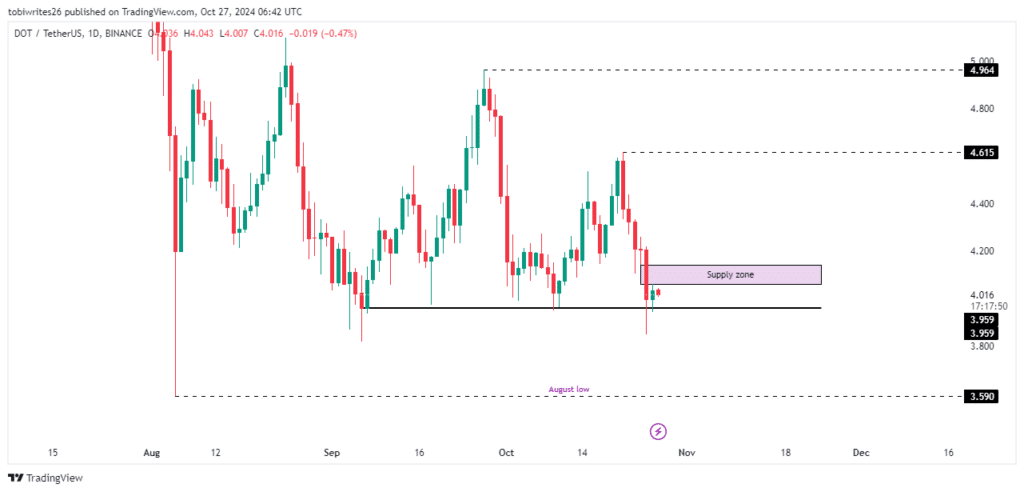
    DOT is currently trading between two significant levels that could shape its direction in the upcoming sessions.

    After recently bouncing off a support level at 3.959, DOT could rally to 4.615 or 4.964 if this support holds. However, a supply zone lies directly above, which could trigger selling pressure and push the price lower, potentially returning DOT to its August low.

    Source: Trading View

    To assess the potential movement, AMBCrypto analyzed technical indicators, but found mixed signals, leaving the outlook uncertain.

    No clear pattern from traders: mixed signals for DOT

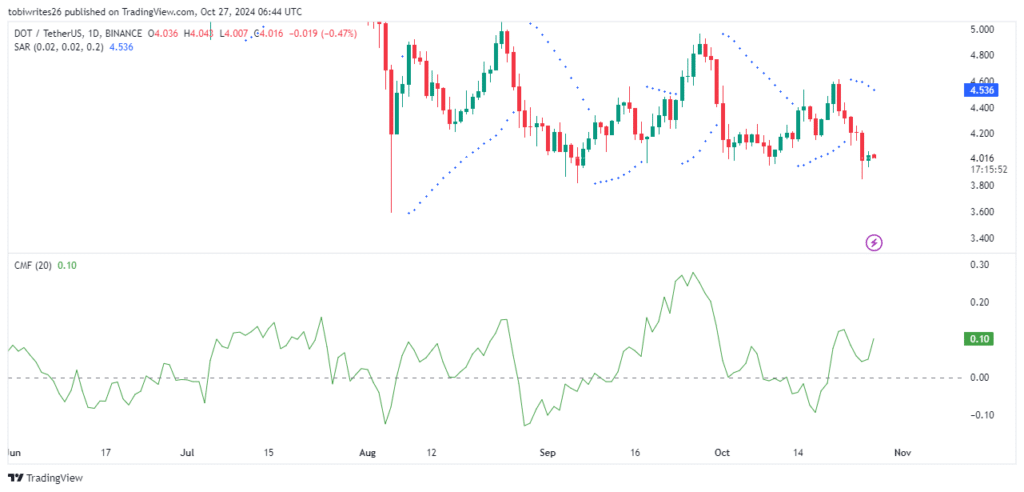
    Two major indicators, the Chaikin Money Flow (CMF) and Parabolic SAR (Stop and Reverse), present a blend of bullish and bearish signals for DOT, leaving its future direction uncertain.

    The Chaikin Money Flow (CMF), which assesses the flow of liquidity into or out of an asset, has shown an uptick, with a current reading of 0.11. A positive CMF value suggests increasing buying pressure, which typically aligns with a potential upward price movement for DOT.

    This reading indicates that if this momentum continues, DOT could push through its current supply zone, potentially sustaining a rally.

    Conversely, the Parabolic SAR, a trend-following indicator that signals reversals, displays a bearish sentiment. This is indicated by multiple dots above DOT’s price, suggesting ongoing selling pressure and a likely continuation of the downtrend.

    When the Parabolic SAR dots appear above the asset’s price, it signals resistance and the potential for further price declines.

    Source: Trading View

    With these two indicators suggesting opposing trends, AMBCrypto turned to on-chain activity to provide additional insights into DOT’s next move.

    Gradual buying pressure emerges for Polkadot

    Data from Coinglass indicates a positive funding rate for DOT, suggesting an increase in long interest from traders.As of the latest reading, DOT’s funding rate stands at 0.0109%.


    Read Polkadot’s [DOT] Price Prediction 2024-25


    A positive funding rate means that traders holding long positions are paying those holding short positions to maintain price equilibrium. This trend typically points to an underlying bullish sentiment, as more traders are betting on price increases, which could push DOT higher.

    If this buying pressure continues, DOT may break through its current supply zone and trend further upward.
    Next: Mapping XRP’s path to key resistance amid rising Open Interest

    Source link

    Share. Facebook Twitter Pinterest LinkedIn Tumblr Email Copy Link
    Previous ArticleIsrael bill to restrict UN relief for Palestinians sparks ‘grave concern’
    Next Article Cruise News: Royal Caribbean sued over peeping Tom crew member
    Anthony M. Orbison
    • Website

    Related Posts

    El Salvador stacks 7 Bitcoin in last week, despite IMF deal

    May 11, 2025

    Ex-UFC champ Conor McGregor touts Irish Bitcoin reserve in presidential bid

    May 11, 2025

    Altseason is coming, 40% daily gains to become ‘new normal’ — Analyst

    May 11, 2025
    Leave A Reply Cancel Reply

    Amazon.com, Inc.
    $193.06
    $0.98
    0.51%
    Meta Platforms, Inc.
    $592.49
    $5.52
    0.92%
    S&P 500
    $5,659.91
    $4.03
    0.07%
    Alphabet Inc.
    $154.38
    $1.37
    0.88%
    EUR/USD
    $1.12
    $0.002
    0.18%
    EUR/JPY
    $163.52
    $0.192
    0.12%
    USD/CAD
    $1.39
    $0.0013
    0.09%

    Risk Disclosure: Trading in financial instruments and/or cryptocurrencies involves high risks including the risk of losing some, or all, of your investment amount, and may not be suitable for all investors. Prices of cryptocurrencies are extremely volatile and may be affected by external factors such as financial, regulatory or political events. Trading on margin increases the financial risks.
    Before deciding to trade in financial instrument or cryptocurrencies you should be fully informed of the risks and costs associated with trading the financial markets, carefully consider your investment objectives, level of experience, and risk appetite, and seek professional advice where needed.
    Fusion Media would like to remind you that the data contained in this website is not necessarily real-time nor accurate. The data and prices on the website are not necessarily provided by any market or exchange, but may be provided by market makers, and so prices may not be accurate and may differ from the actual price at any given market, meaning prices are indicative and not appropriate for trading purposes. Fusion Media and any provider of the data contained in this website will not accept liability for any loss or damage as a result of your trading, or your reliance on the information contained within this website.
    It is prohibited to use, store, reproduce, display, modify, transmit or distribute the data contained in this website without the explicit prior written permission of Fusion Media and/or the data provider. All intellectual property rights are reserved by the providers and/or the exchange providing the data contained in this website.
    Fusion Media may be compensated by the advertisers that appear on the website, based on your interaction with the advertisements or advertisers.
    We're social. Connect with us:

    Facebook X (Twitter)
    • Home
    • About us
    • Contact
    • Disclaimer
    • Privacy Policy
    © 2025 Marketsnews.co.uk

    Type above and press Enter to search. Press Esc to cancel.