Close Menu
    What's Hot

    Exodus Hits Record Q1 Revenue As Bitcoin Holdings Rise To 2,011 BTC

    AI Predicts Bitcoin’s Price If Zuckerberg Adds BTC To Meta

    Bitcoin price sells off after Trump’s US-China tariff deal — Here is why

    Facebook X (Twitter) Instagram
    MarketsNews.co.uk
    • Live Chart
    • Brokers
    • Scam Broker
    • Reviews
    • Tools
      • Lot Size Calculator
      • Margin Calculator
      • PIPS Calculator
      • Profit & loss calculator
    Facebook X (Twitter) Instagram
    Start Trading
    Trending Topics:
    • Markets
    • Stocks
    • Cryptocurrency
    • Forex
    • Scam Broker
    MarketsNews.co.uk
    • Markets
    • Stocks
    • Cryptocurrency
    • Forex
    • Scam Broker
    Cryptocurrency

    Polygon: Can network growth help POL overcome selling pressure?

    Anthony M. OrbisonBy Anthony M. OrbisonOctober 31, 2024No Comments3 Mins Read
    Share Facebook Twitter Pinterest Copy Link Telegram LinkedIn Tumblr Email
    Share
    Facebook Twitter LinkedIn Pinterest Email
    • Polygon’s DeFi TVL has surged to a 7-month high of $1.16 billion.
    • Despite the network growth, POL still showed bearish signals with a rounding top pattern on its four-hour chart. 

    POL (formerly MATIC) has been under bearish pressure after dropping by nearly 20% in 30 days.

    As AMBCrypto reported, more than 98% of POL holders are sitting on losses, highlighting negative market sentiment. 

    POL traded at $0.324 at press time. Data from CoinMarketCap shows trading volumes had dropped by 5% suggesting waning interest in traders in the altcoin. 

    Despite the price drop, the Polygon network has recorded a surge in activity, especially in decentralized finance (DeFi). 

    Polygon DeFi TVL reaches 7-month high 

    Polygon’s DeFi Total Value Locked (TVL) stood at $1.164 at press time per DeFiLlama. The TVL is at its highest level since March, showing rising usage for DeFi applications built on the network. 

    At the same time, DeFi volumes have recorded a gradual growth to $267M at press time. The last time that Polygon’s DeFi volumes were at these levels was also in March.
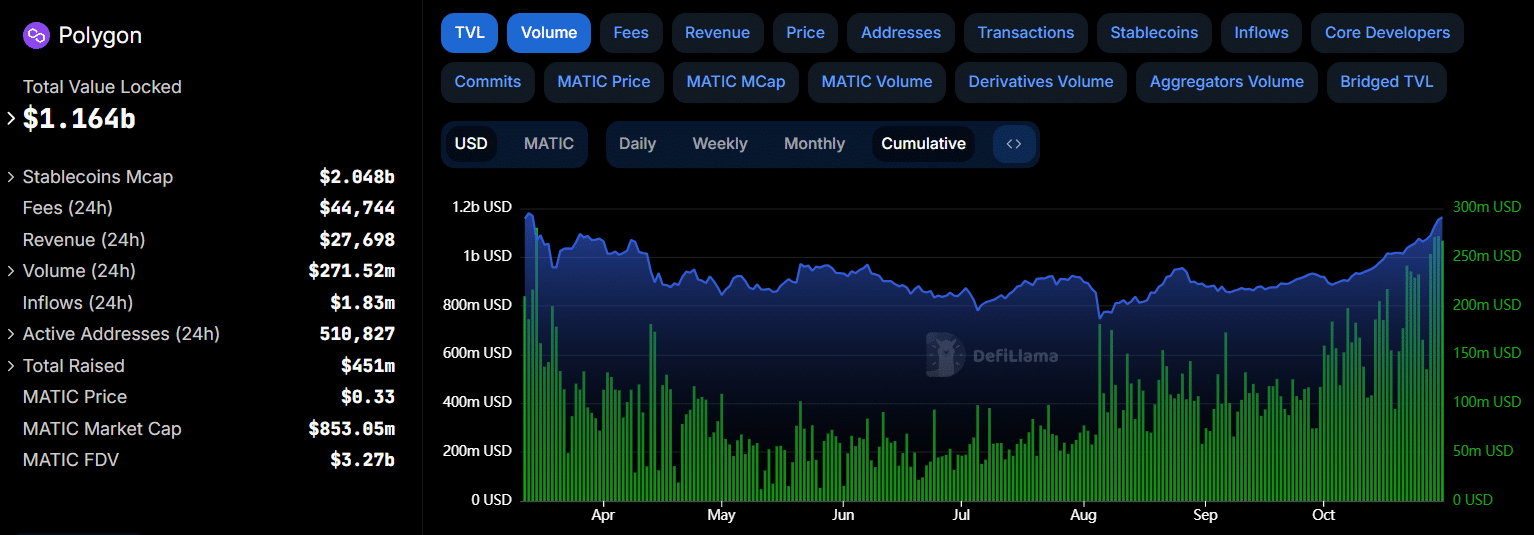
    (Source: DeFiLlama)

    The top application driving the surge is the Polymarket betting site, which accounts for $353M of the network’s TVL.

    This month alone, Polymarket’s TVL has nearly tripled, with the upcoming U.S. elections being a catalyst for this growth. 

    Despite this positive data, the POL token continues to portray bearish signals. 

    POL forms a rounding top pattern

    Polygon appears to be coiling up for a rounding top pattern. This is a bearish reversal pattern that suggests POL is cooling off from its bullish trend as selling pressure gradually increases. 

    POL will complete the rounding top pattern if it drops to test support at $0.31.

    If POL establishes this neckline and breaches this support, it could create a sell signal that could send prices plunging lower. 

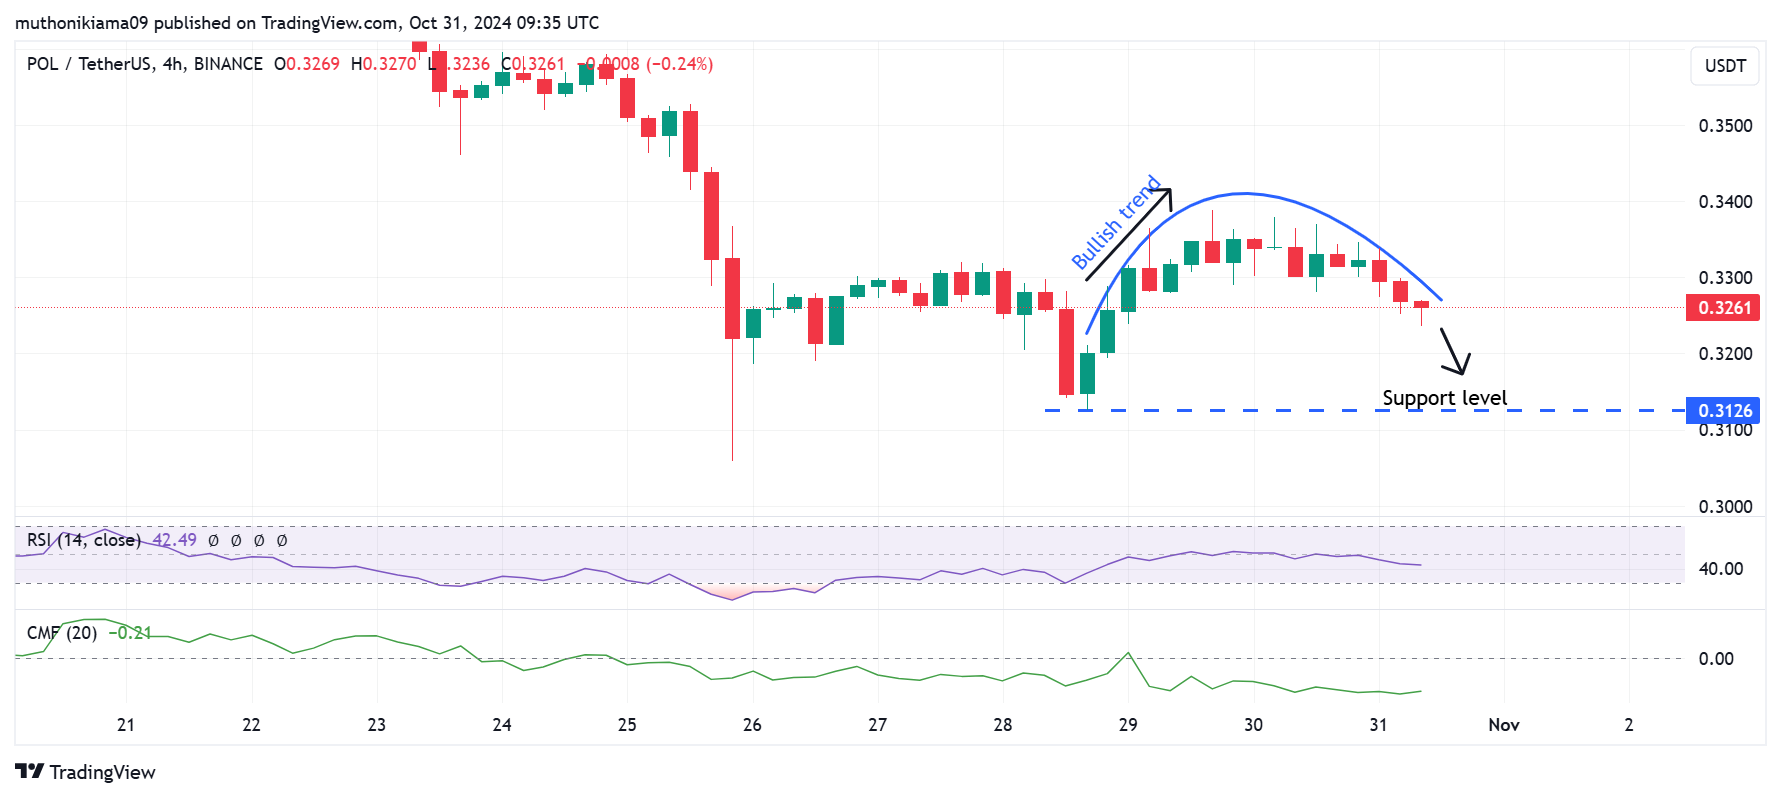
    (Source: Tradingview)

    Technical indicators hint at further downward momentum. The Chaikin Money Flow (CMF) has a negative value of -0.21 showing that the selling pressure is higher than the buying pressure. 

    The Relative Strength Index (RSI), which has a reading of 42, also points towards bearish momentum.

    The RSI is also tipping south, indicating that selling activity is increasing. If buyers fail to step in, it further reinforces the bearish thesis around POL. 

    Polygon’s derivatives data shows THIS 

    The derivatives market shows more bearish signs around POL. Despite the 8% surge in volumes, open interest had dropped by 3% to $49M at press time. 

    This drop shows that derivative traders are closing their existing positions on POL.

    The reduced market participation also indicates a lack of conviction among traders in POL’s future price movements.
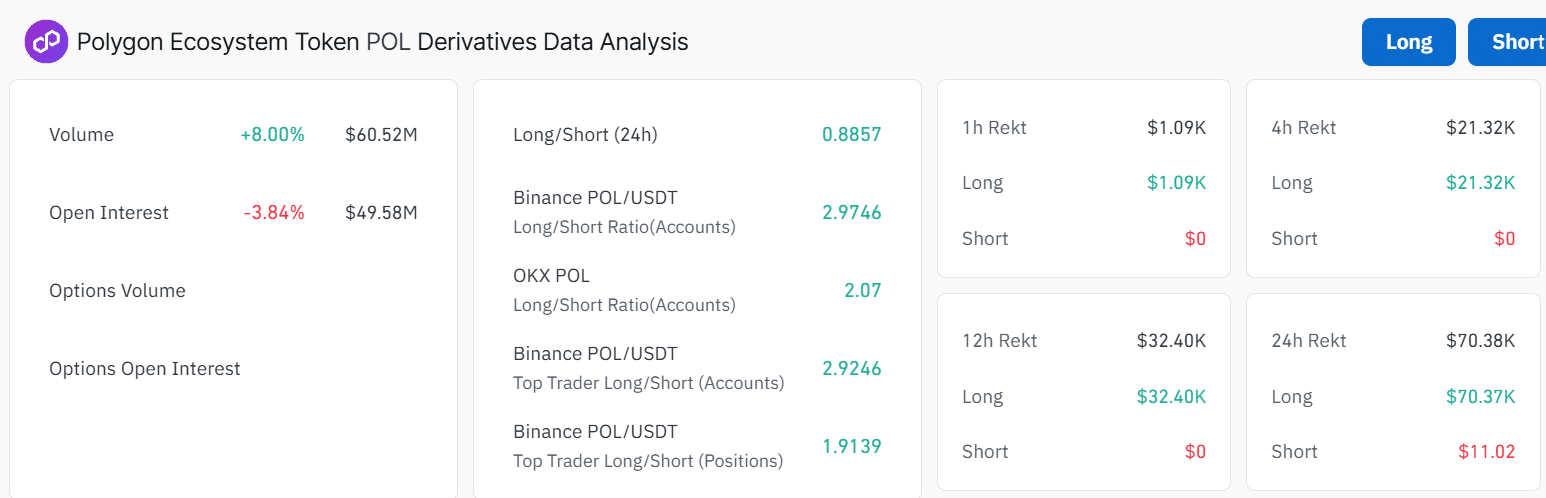
    (Source: Coinglass)

    The long/short ratio at 0.88 shows that short positions are more than long positions, further underscoring the bearish sentiment. However, on Binance, there are more traders with long positions than short positions. 


    Is your portfolio green? Check out the POL Profit Calculator


    The bias towards short positions could be attributed to an influx of liquidations. In the last 24 hours, more than 90% of the liquidated trades have been short positions. 

    Despite the retail market showing a bearish sentiment towards POL, institutions or smart traders remain bullish per Market Prophit. 

    (Source: Market Prophit)

    Next: XRP price prediction: A drop below $0.5 seems likely and here’s why

    Source link

    Share. Facebook Twitter Pinterest LinkedIn Tumblr Email Copy Link
    Previous ArticleApple sales grew 6% over the last quarter with a rebound in iPhone demand 
    Next Article Intel rises on recovery hopes as it forecasts revenue above estimates By Reuters
    Anthony M. Orbison
    • Website

    Related Posts

    Exodus Hits Record Q1 Revenue As Bitcoin Holdings Rise To 2,011 BTC

    May 12, 2025

    AI Predicts Bitcoin’s Price If Zuckerberg Adds BTC To Meta

    May 12, 2025

    Bitcoin price sells off after Trump’s US-China tariff deal — Here is why

    May 12, 2025
    Leave A Reply Cancel Reply

    Amazon.com, Inc.
    $208.64
    $15.58
    8.07%
    Meta Platforms, Inc.
    $639.43
    $46.94
    7.92%
    S&P 500
    $5,844.19
    $184.28
    3.26%
    Alphabet Inc.
    $159.58
    $5.20
    3.37%
    EUR/USD
    $1.11
    $0.0006
    0.06%
    EUR/JPY
    $164.64
    $0.124
    0.08%
    USD/CAD
    $1.40
    $0.0009
    0.06%

    Risk Disclosure: Trading in financial instruments and/or cryptocurrencies involves high risks including the risk of losing some, or all, of your investment amount, and may not be suitable for all investors. Prices of cryptocurrencies are extremely volatile and may be affected by external factors such as financial, regulatory or political events. Trading on margin increases the financial risks.
    Before deciding to trade in financial instrument or cryptocurrencies you should be fully informed of the risks and costs associated with trading the financial markets, carefully consider your investment objectives, level of experience, and risk appetite, and seek professional advice where needed.
    Fusion Media would like to remind you that the data contained in this website is not necessarily real-time nor accurate. The data and prices on the website are not necessarily provided by any market or exchange, but may be provided by market makers, and so prices may not be accurate and may differ from the actual price at any given market, meaning prices are indicative and not appropriate for trading purposes. Fusion Media and any provider of the data contained in this website will not accept liability for any loss or damage as a result of your trading, or your reliance on the information contained within this website.
    It is prohibited to use, store, reproduce, display, modify, transmit or distribute the data contained in this website without the explicit prior written permission of Fusion Media and/or the data provider. All intellectual property rights are reserved by the providers and/or the exchange providing the data contained in this website.
    Fusion Media may be compensated by the advertisers that appear on the website, based on your interaction with the advertisements or advertisers.
    We're social. Connect with us:

    Facebook X (Twitter)
    • Home
    • About us
    • Contact
    • Disclaimer
    • Privacy Policy
    © 2025 Marketsnews.co.uk

    Type above and press Enter to search. Press Esc to cancel.