Close Menu
    What's Hot

    Craig Wright sent enemies to legal ‘hell,’ says judge in restraining order

    The Blockchain Group Raises €12.1M With Adam Back To Push Bitcoin Strategy

    Businesses are the biggest Bitcoin buyers this year

    Facebook X (Twitter) Instagram
    MarketsNews.co.uk
    • Live Chart
    • Brokers
    • Scam Broker
    • Reviews
    • Tools
      • Lot Size Calculator
      • Margin Calculator
      • PIPS Calculator
      • Profit & loss calculator
    Facebook X (Twitter) Instagram
    Start Trading
    Trending Topics:
    • Markets
    • Stocks
    • Cryptocurrency
    • Forex
    • Scam Broker
    MarketsNews.co.uk
    • Markets
    • Stocks
    • Cryptocurrency
    • Forex
    • Scam Broker
    Cryptocurrency

    Worldcoin Rejection At $2.1 Sparks Concerns Of Prolonged Downtrend

    Anthony M. OrbisonBy Anthony M. OrbisonNovember 1, 2024No Comments3 Mins Read
    Share Facebook Twitter Pinterest Copy Link Telegram LinkedIn Tumblr Email
    Share
    Facebook Twitter LinkedIn Pinterest Email

    Este artículo también está disponible en español.

    Worldcoin’s recent failure to breach the $2.15 resistance level has put the token under renewed bearish pressure, leaving investors to question if a prolonged downtrend may be unfolding. The $2.15 mark has become a key battleground, with sellers pushing prices lower each time buyers attempt a breakout. As Worldcoin struggles to regain upward momentum, the risk of further declines grows, signaling potential challenges ahead.

    This article aims to explore the implications of Worldcoin’s recent struggle at the $2.1 resistance level and evaluate whether it could signal an extended downtrend. Through an analysis of technical indicators and current market dynamics, we’ll assess the possible risks and opportunities for Worldcoin, offering traders insights into what may lie ahead for the token’s price movement.

    Technical Indicators Signal Potential For Extended Downtrend

    On the 4-hour chart, WLD’s price is exhibiting negative momentum, trading below the 100-day Simple Moving Average (SMA) as it trends downward toward the $1.27 support level. A continued descent toward the $1.27 support suggests that selling pressure is building, and if the support fails to hold, Worldcoin could experience more declines.

    WRLD falls below the 100-day SMA as it heads toward $1.27 | Source: WLDUSDT on Tradingview.com

    Also, the 4-hour Composite Trend Oscillator for WLD is showing bearish signals, with the SMA line crossing below the signal lines and approaching the oversold zone, suggesting that sellers are becoming more dominant. As the indicator nears oversold territory, it reflects heightened selling pressure, raising the potential for a downtrend.

    Related Reading

    On the daily chart, Worldcoin is exhibiting strong downward momentum, characterized by a bearish candlestick pattern following a failed attempt to break through the resistance at $2.15,  indicating increased selling pressure and that the asset may continue to drop.

    Worldcoin
    Worldcoin struggles after failing to break above $2.15 | Source: WLDUSDT on Tradingview.com

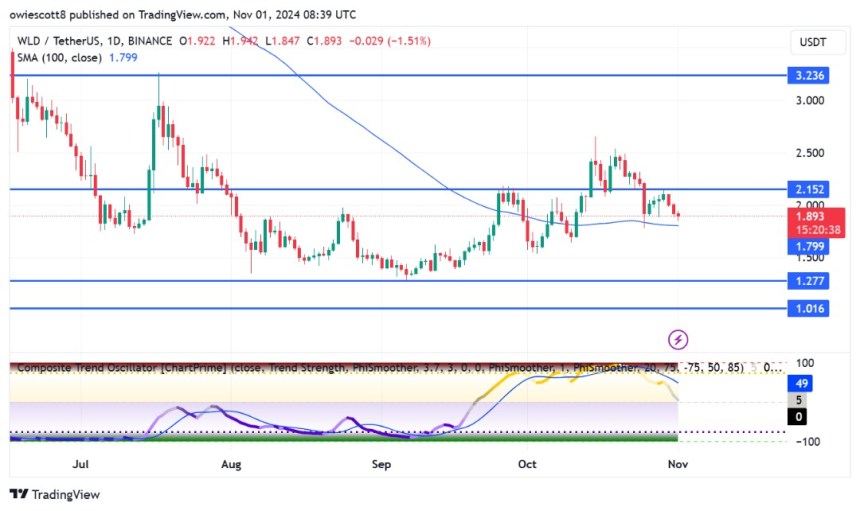
    Additionally, WLD is currently facing challenges as it attempts to drop below the 100-day SMA, a key indicator that typically signals a pessimistic trend when breached. If WLD manages to close below this level, it could further confirm the negative sentiment in the market, potentially leading to additional selling and a sustained downturn.

    A detailed analysis of the 1-day Composite Trend Oscillator shows that WLD is likely facing extended losses. The signal line has crossed below the SMA line and is trending downward toward the zero line, indicating a negative shift in momentum. Should the downward trend persist, Worldcoin could encounter significant difficulties in recovering, resulting in a prolonged period of waning price movement.

    Worldcoin Price Outlook: Will Bears Maintain Control?

    As Worldcoin encounters heightened downside pressure after being rejected at the $2.15 resistance level, key support zones become crucial to monitor. If bears continue to assert control, they may push the price down to the $1.27 support level.

    Related Reading

    A breakdown below this level could lead to further losses, possibly testing other support levels and intensifying pessimistic sentiment in the market. Conversely, if support holds, it may restore confidence among buyers and create an opportunity for a price recovery.

    Worldcoin
    WLD trading at $1.9 on the 1D chart | Source: WLDUSDT on Tradingview.com

    Featured image from YouTube, chart from Tradingview.com

    Source link

    Share. Facebook Twitter Pinterest LinkedIn Tumblr Email Copy Link
    Previous ArticleBoeing slashes DEI department in latest staff shake-up
    Next Article Boeing shares rise on hopes new wage offer will end strike By Reuters
    Anthony M. Orbison
    • Website

    Related Posts

    Craig Wright sent enemies to legal ‘hell,’ says judge in restraining order

    May 13, 2025

    The Blockchain Group Raises €12.1M With Adam Back To Push Bitcoin Strategy

    May 13, 2025

    Businesses are the biggest Bitcoin buyers this year

    May 13, 2025
    Leave A Reply Cancel Reply

    Amazon.com, Inc.
    $208.64
    $15.58
    8.07%
    Meta Platforms, Inc.
    $639.43
    $46.94
    7.92%
    S&P 500
    $5,844.19
    $184.28
    3.26%
    Alphabet Inc.
    $159.58
    $5.20
    3.37%
    EUR/USD
    $1.11
    $0.0016
    0.14%
    EUR/JPY
    $164.28
    $0.23
    0.14%
    USD/CAD
    $1.40
    $0.0013
    0.09%

    Risk Disclosure: Trading in financial instruments and/or cryptocurrencies involves high risks including the risk of losing some, or all, of your investment amount, and may not be suitable for all investors. Prices of cryptocurrencies are extremely volatile and may be affected by external factors such as financial, regulatory or political events. Trading on margin increases the financial risks.
    Before deciding to trade in financial instrument or cryptocurrencies you should be fully informed of the risks and costs associated with trading the financial markets, carefully consider your investment objectives, level of experience, and risk appetite, and seek professional advice where needed.
    Fusion Media would like to remind you that the data contained in this website is not necessarily real-time nor accurate. The data and prices on the website are not necessarily provided by any market or exchange, but may be provided by market makers, and so prices may not be accurate and may differ from the actual price at any given market, meaning prices are indicative and not appropriate for trading purposes. Fusion Media and any provider of the data contained in this website will not accept liability for any loss or damage as a result of your trading, or your reliance on the information contained within this website.
    It is prohibited to use, store, reproduce, display, modify, transmit or distribute the data contained in this website without the explicit prior written permission of Fusion Media and/or the data provider. All intellectual property rights are reserved by the providers and/or the exchange providing the data contained in this website.
    Fusion Media may be compensated by the advertisers that appear on the website, based on your interaction with the advertisements or advertisers.
    We're social. Connect with us:

    Facebook X (Twitter)
    • Home
    • About us
    • Contact
    • Disclaimer
    • Privacy Policy
    © 2025 Marketsnews.co.uk

    Type above and press Enter to search. Press Esc to cancel.