Close Menu
    What's Hot

    Analysts Explain Why ETH is en Route to Overtaking Bitcoin

    Bitcoin shrugs off US CPI win as Binance CEO says BTC ‘leading pack’

    Dubai Partners To Accept Bitcoin And Crypto For Government Services

    Facebook X (Twitter) Instagram
    MarketsNews.co.uk
    • Live Chart
    • Brokers
    • Scam Broker
    • Reviews
    • Tools
      • Lot Size Calculator
      • Margin Calculator
      • PIPS Calculator
      • Profit & loss calculator
    Facebook X (Twitter) Instagram
    Start Trading
    Trending Topics:
    • Markets
    • Stocks
    • Cryptocurrency
    • Forex
    • Scam Broker
    MarketsNews.co.uk
    • Markets
    • Stocks
    • Cryptocurrency
    • Forex
    • Scam Broker
    Cryptocurrency

    Sui flips Solana, Ethereum on THIS front – What about SUI’s price?

    Anthony M. OrbisonBy Anthony M. OrbisonNovember 3, 2024No Comments2 Mins Read
    Share Facebook Twitter Pinterest Copy Link Telegram LinkedIn Tumblr Email
    Share
    Facebook Twitter LinkedIn Pinterest Email
    • Sui eclipsed Solana and Ethereum on net inflows. 
    • But SUI’s pullback could extend lower to $1.7 if the weakening persisted. 

    Sui [Sui] has been among the top emerging blockchains in 2024, ready to slash part of Ethereum [ETH] and Solana’s [SOL] market share.

    Recently, the chain surpassed ETH and SOL on net inflows, as noted by Mysten Labs co-founder Adeniyi Abiodun, who also leads the team behind the Sui chain. 

    He said,

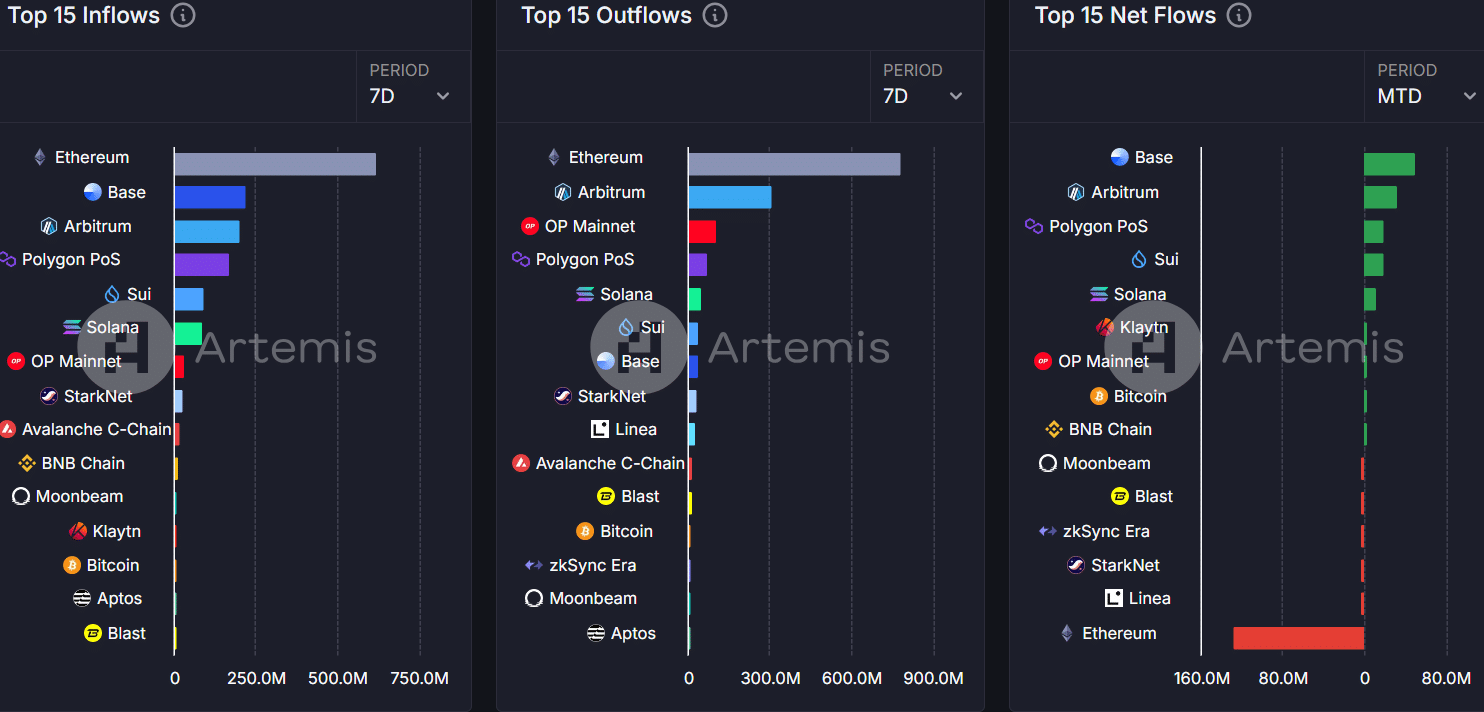
    “Sui recorded higher net inflows than Solana and Ethereum combined with $24.3M” 

    Sui

    Source: Artemis

    Artemis data showed Sui had a significant lead over the past 7 seven trading days on inflows, outflows and netflows.

    It saw more inflows than Solana on the weekly charts. On a month-to-date (MTD) basis, it had $19.3 million in net inflows compared to Solana’s $12.3 million as of the time of writing. 

    SUI vs SOL

    Sui has been deemed a great alternative to SOL, and some analysts even believe that SUI’s price action could follow SOL’s trajectory.

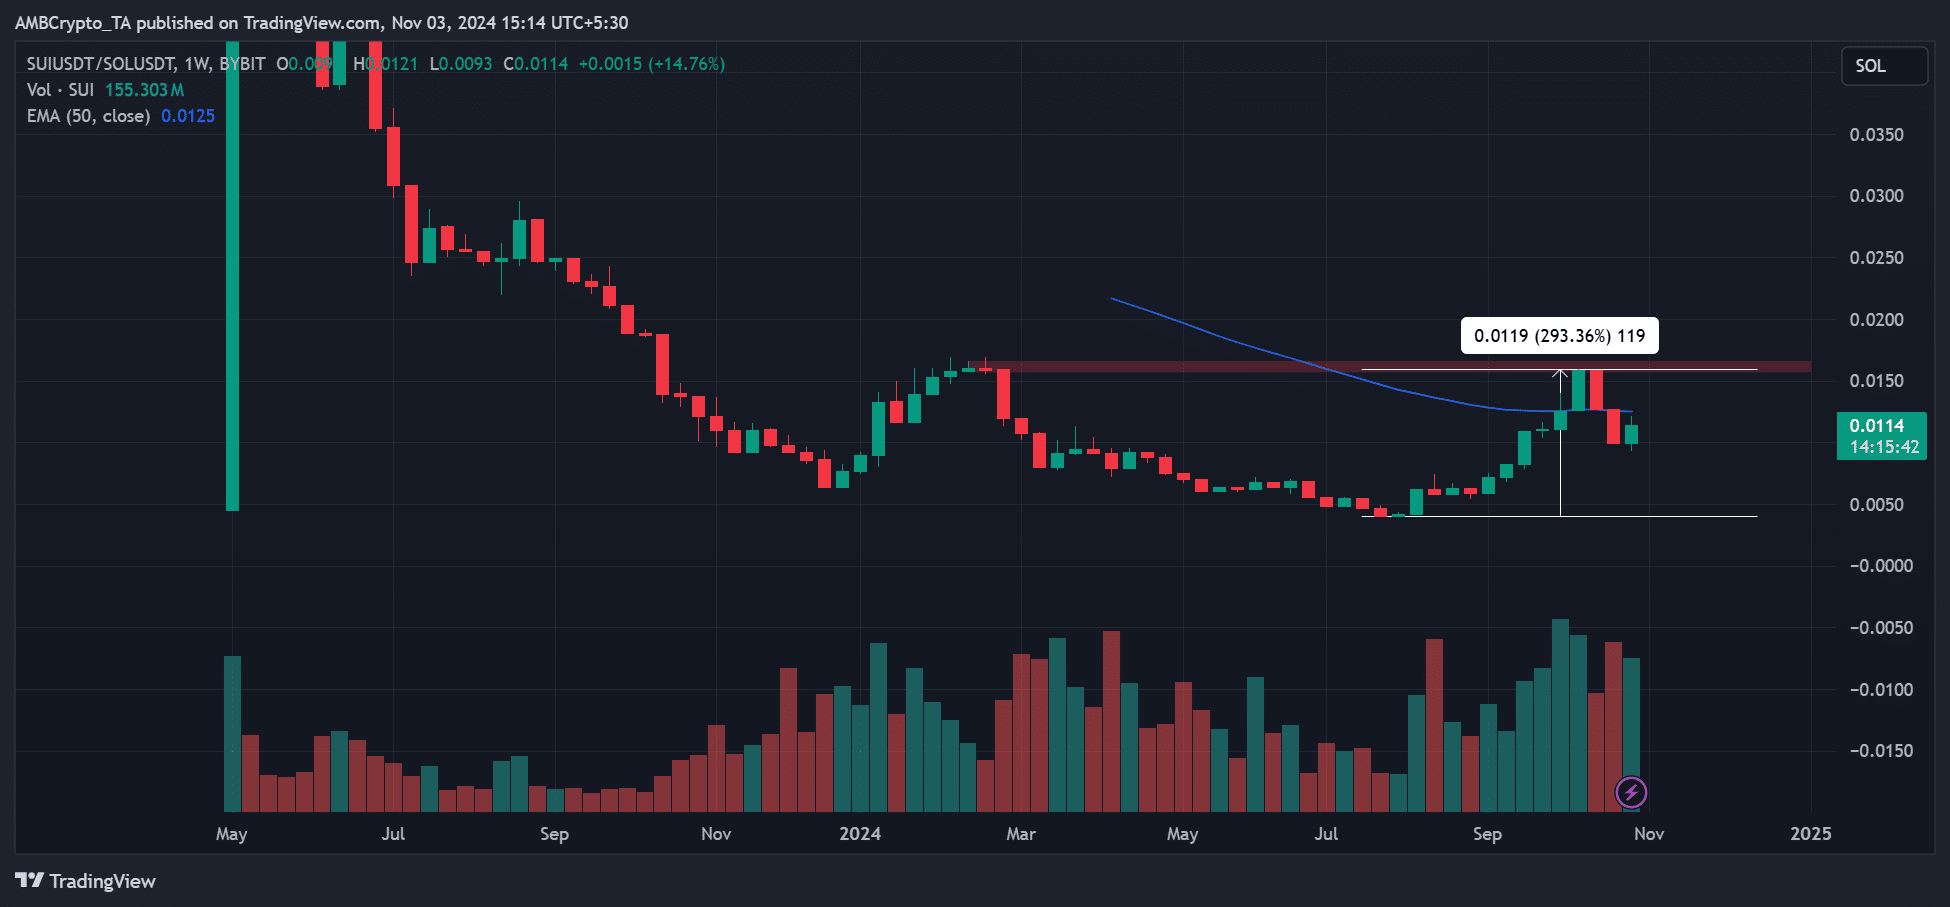
    In fact, SUI outperformed SOL on the price charts in August and September, as shown by the wild 300% run-up in SUI/SOL ratio. 

    SuiSui

    Source: SUI/SOL, TradigView

    The SUI/SOL ratio tracks SUI’s relative performance to SOL. However, in October, the ratio declined, suggesting that SUI underperformed SOL. 

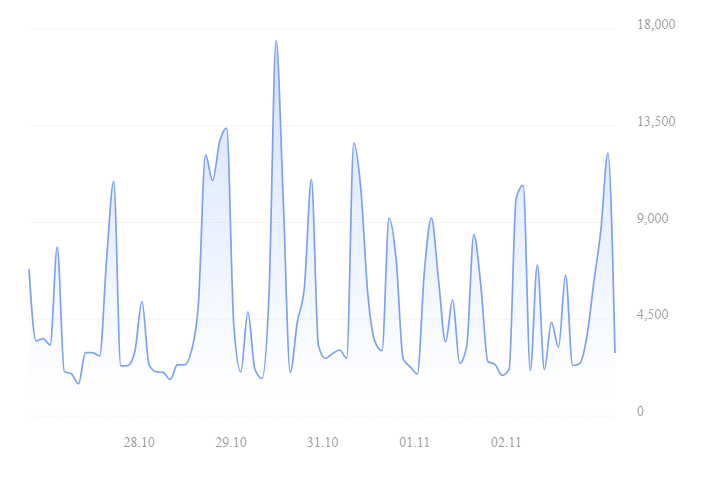
    However, the chain still saw modest network growth, which could signal increased interest and boost SUI prices. Its new accounts surged 5% in the past 7 days and reached 862.7K, which marked increased market interest in the altcoin. 

    SuiSui

    Source: Sui Explorer

    Despite the surge in interest, SUI’s market positioning was almost neutral, mirroring the broader market sentiment ahead of the US elections. 


    Read Sui [SUI] Price Prediction 2024-2025 


    Top traders on Binance had a slight dominance in long positions, at 51%, compared to nearly 49% shorts. The negligible difference meant that the market could go either direction in the short term, depending on the election outcome. 

    SuiSui

    Source: Coinglass

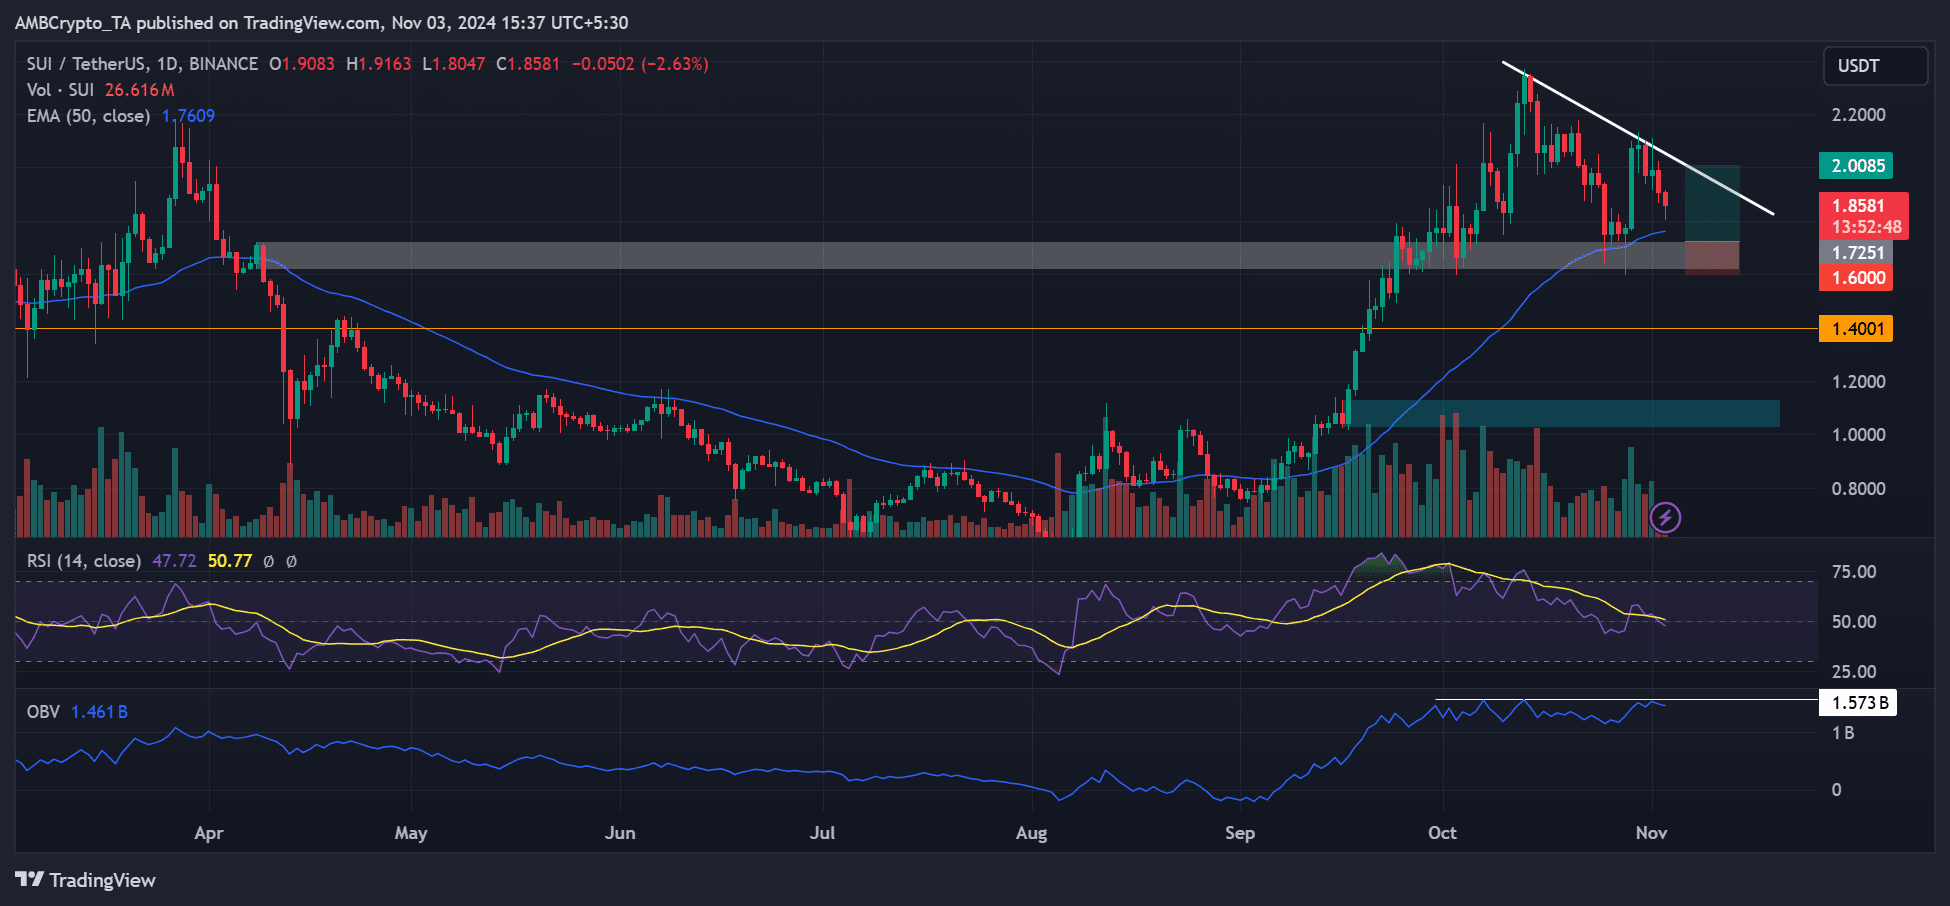
    However, the price chart showed a strong support above $1.6, which triggered a price rebound in September and October.

    If the pattern repeats, SUI could recover from it and eye the trendline resistance near $2. That would be a 16% potential recovery from the $1.6 – $1.7 support zone. 

    SuiSui

    Source: SUI/USDT, TradingView

    Next: Crypto market’s weekly winners and losers – RAY, DOGE, IMX, MEW

    Source link

    Share. Facebook Twitter Pinterest LinkedIn Tumblr Email Copy Link
    Previous ArticleChina piles pressure on rich people and companies to cough up taxes
    Next Article Nvidia to reap billions in big tech AI spending
    Anthony M. Orbison
    • Website

    Related Posts

    Analysts Explain Why ETH is en Route to Overtaking Bitcoin

    May 13, 2025

    Bitcoin shrugs off US CPI win as Binance CEO says BTC ‘leading pack’

    May 13, 2025

    Dubai Partners To Accept Bitcoin And Crypto For Government Services

    May 13, 2025
    Leave A Reply Cancel Reply

    Amazon.com, Inc.
    $211.37
    $2.73
    1.31%
    Meta Platforms, Inc.
    $656.03
    $16.60
    2.60%
    S&P 500
    $5,886.55
    $42.36
    0.72%
    Alphabet Inc.
    $160.89
    $1.31
    0.82%
    EUR/USD
    $1.12
    $0.0104
    0.94%
    EUR/JPY
    $165.01
    $0.499
    0.30%
    USD/CAD
    $1.39
    $0.0043
    0.30%

    Risk Disclosure: Trading in financial instruments and/or cryptocurrencies involves high risks including the risk of losing some, or all, of your investment amount, and may not be suitable for all investors. Prices of cryptocurrencies are extremely volatile and may be affected by external factors such as financial, regulatory or political events. Trading on margin increases the financial risks.
    Before deciding to trade in financial instrument or cryptocurrencies you should be fully informed of the risks and costs associated with trading the financial markets, carefully consider your investment objectives, level of experience, and risk appetite, and seek professional advice where needed.
    Fusion Media would like to remind you that the data contained in this website is not necessarily real-time nor accurate. The data and prices on the website are not necessarily provided by any market or exchange, but may be provided by market makers, and so prices may not be accurate and may differ from the actual price at any given market, meaning prices are indicative and not appropriate for trading purposes. Fusion Media and any provider of the data contained in this website will not accept liability for any loss or damage as a result of your trading, or your reliance on the information contained within this website.
    It is prohibited to use, store, reproduce, display, modify, transmit or distribute the data contained in this website without the explicit prior written permission of Fusion Media and/or the data provider. All intellectual property rights are reserved by the providers and/or the exchange providing the data contained in this website.
    Fusion Media may be compensated by the advertisers that appear on the website, based on your interaction with the advertisements or advertisers.
    We're social. Connect with us:

    Facebook X (Twitter)
    • Home
    • About us
    • Contact
    • Disclaimer
    • Privacy Policy
    © 2025 Marketsnews.co.uk

    Type above and press Enter to search. Press Esc to cancel.