Close Menu
    What's Hot

    MARA Reports $214M In Q1 Revenue, Grows Bitcoin Holdings To 47,531 BTC

    After New Hampshire, Arizona Joins Bitcoin Reserve Race

    Bitcoin rallies above $101,000 as US state level strategic reserves and mass adoption accelerate

    Facebook X (Twitter) Instagram
    MarketsNews.co.uk
    • Live Chart
    • Brokers
    • Scam Broker
    • Reviews
    • Tools
      • Lot Size Calculator
      • Margin Calculator
      • PIPS Calculator
      • Profit & loss calculator
    Facebook X (Twitter) Instagram
    Start Trading
    Trending Topics:
    • Markets
    • Stocks
    • Cryptocurrency
    • Forex
    • Scam Broker
    MarketsNews.co.uk
    • Markets
    • Stocks
    • Cryptocurrency
    • Forex
    • Scam Broker
    Cryptocurrency

    Dogecoin Boom Over? Crypto Analyst Warns Of Sell Signal

    Anthony M. OrbisonBy Anthony M. OrbisonDecember 2, 2024No Comments3 Mins Read
    Share Facebook Twitter Pinterest Copy Link Telegram LinkedIn Tumblr Email
    Share
    Facebook Twitter LinkedIn Pinterest Email

    Este artículo también está disponible en español.

    After staging a massive rally, the Dogecoin price is currently in a consolidation phase. And this is also reflected in the technical indicators. Crypto analyst Kevin (@Kev_Capital_TA) is warning of a potential sell indicator. In his latest update on X, Kevin shared a weekly DOGE/USDT chart and outlined technical signs that traders should monitor closely.

    Dogecoin Price Analysis

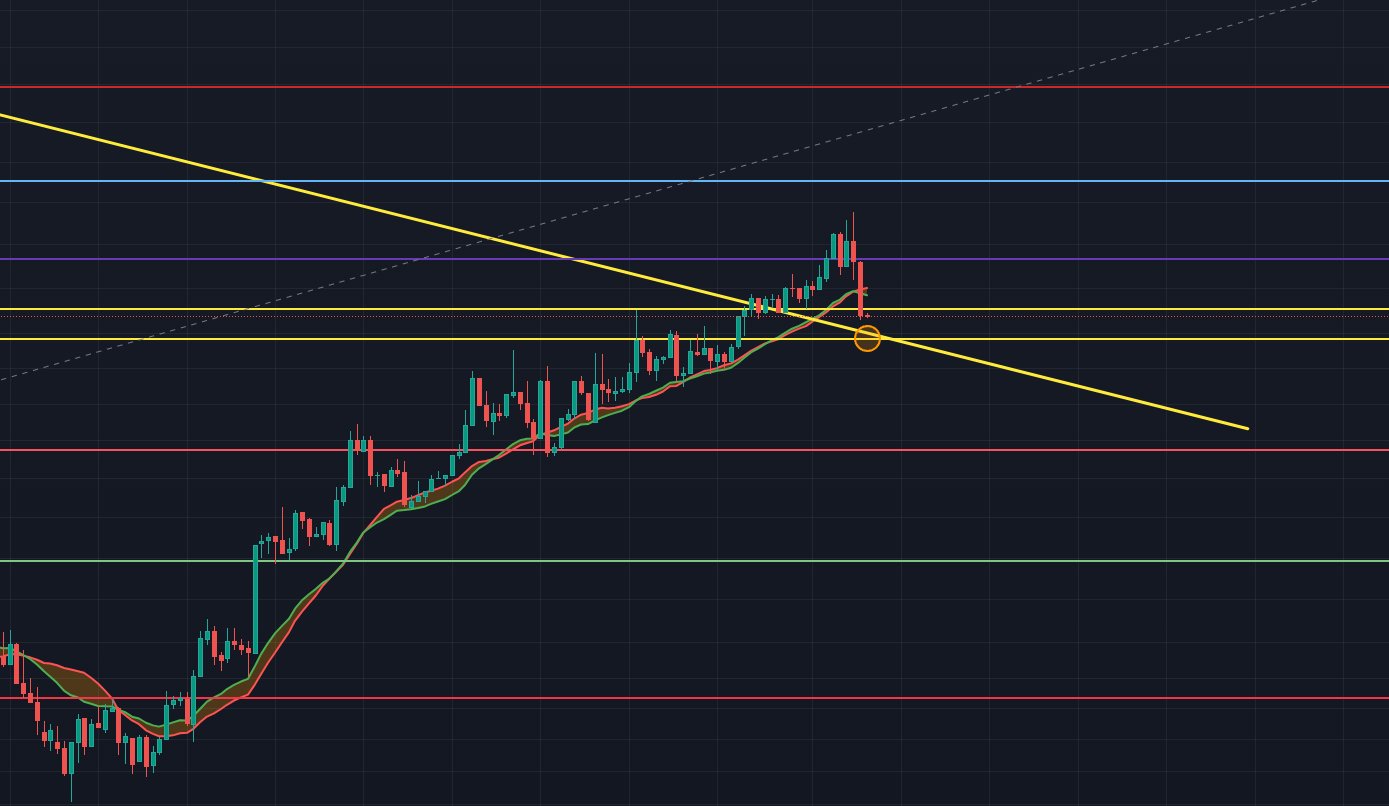
    Kevin highlighted that Dogecoin is “printing a sell signal on the weekly time frame with the red dot appearing,” cautioning that this signal requires confirmation over the next week to solidify its validity. He identified a convergence of three strong technical indicators, including a declining Moving Average Convergence Divergence (MACD) and a Stochastic Relative Strength Index (Stoch RSI) that has “topped out waiting for a bear cross.”

    These indicators collectively suggest that a potential downside may be imminent. However, Kevin balanced this with the observation that “price action still looks bullish and money flow is also bullish,” indicating that these factors currently outweigh the bearish signals.

    Dogecoin technical analysis | Source: @Kev_Capital_TA

    Despite the long-term sell signals, Kevin remains open to the possibility of continued bullish momentum in the short term. He noted that Dogecoin has “close[d] its highest monthly candle body close of all time,” marking a significant milestone while acknowledging that “downside is still a risk.”

    Related Reading

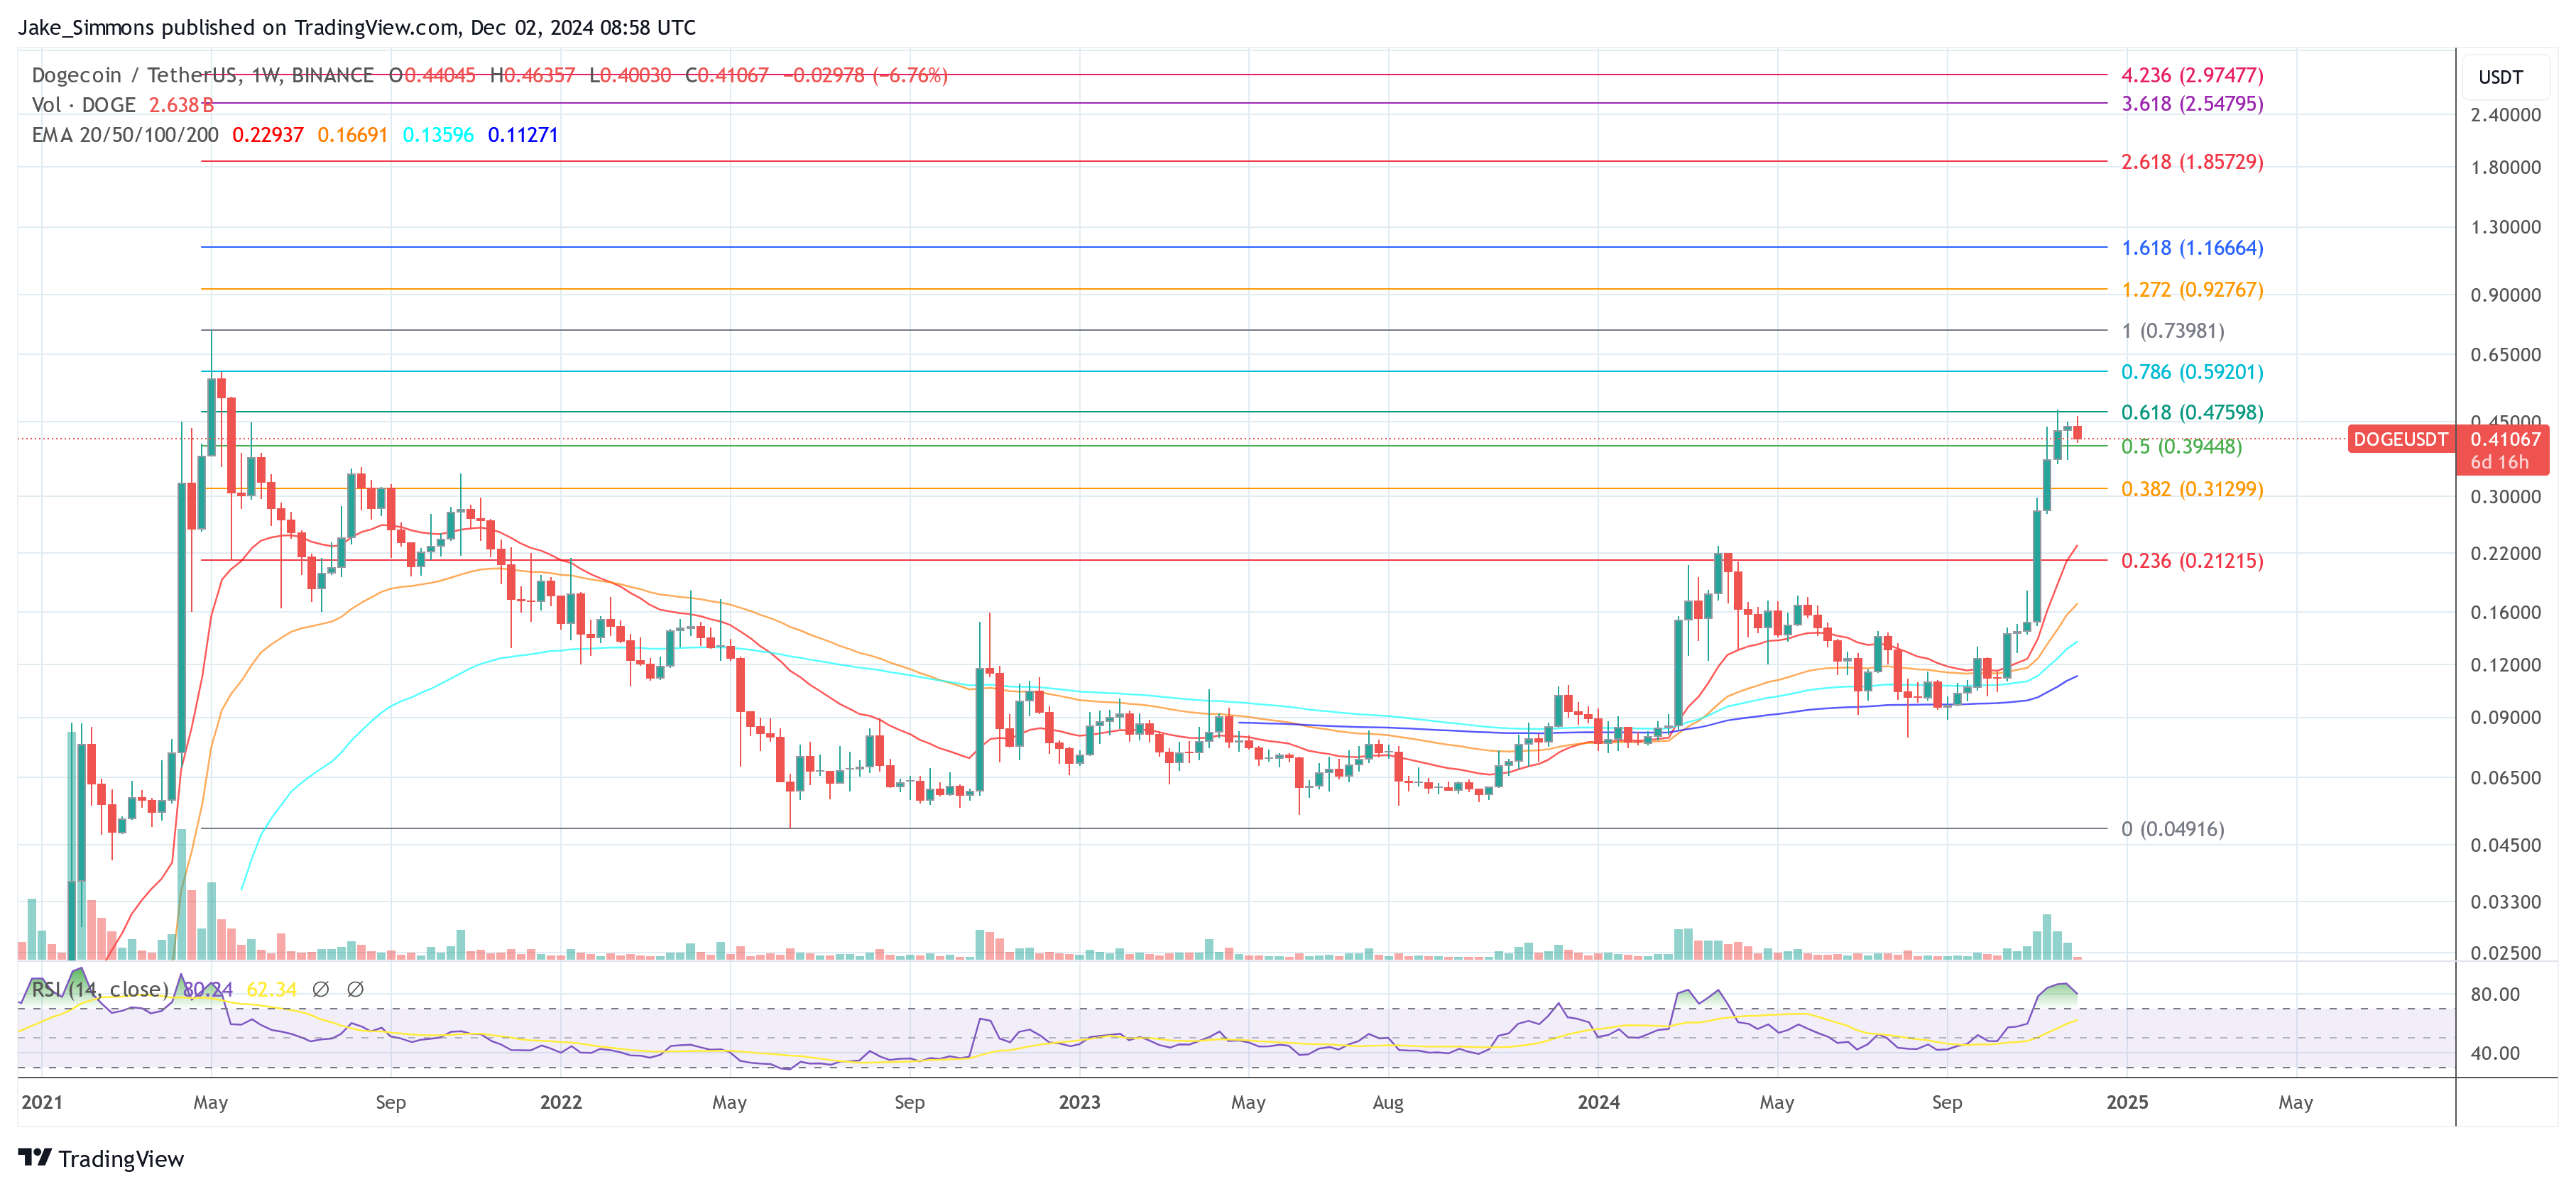
    Looking ahead, Kevin pointed to the importance of a key resistance level, stating, “Until we break $0.60 cents cleanly then there’s nothing to really be excited about,” in reference to his weekly chart that includes Fibonacci price levels extending to $1.

    Dogecoin price analysis
    Dogecoin price analysis, weekly chart | Source: @Kev_Capital_TA

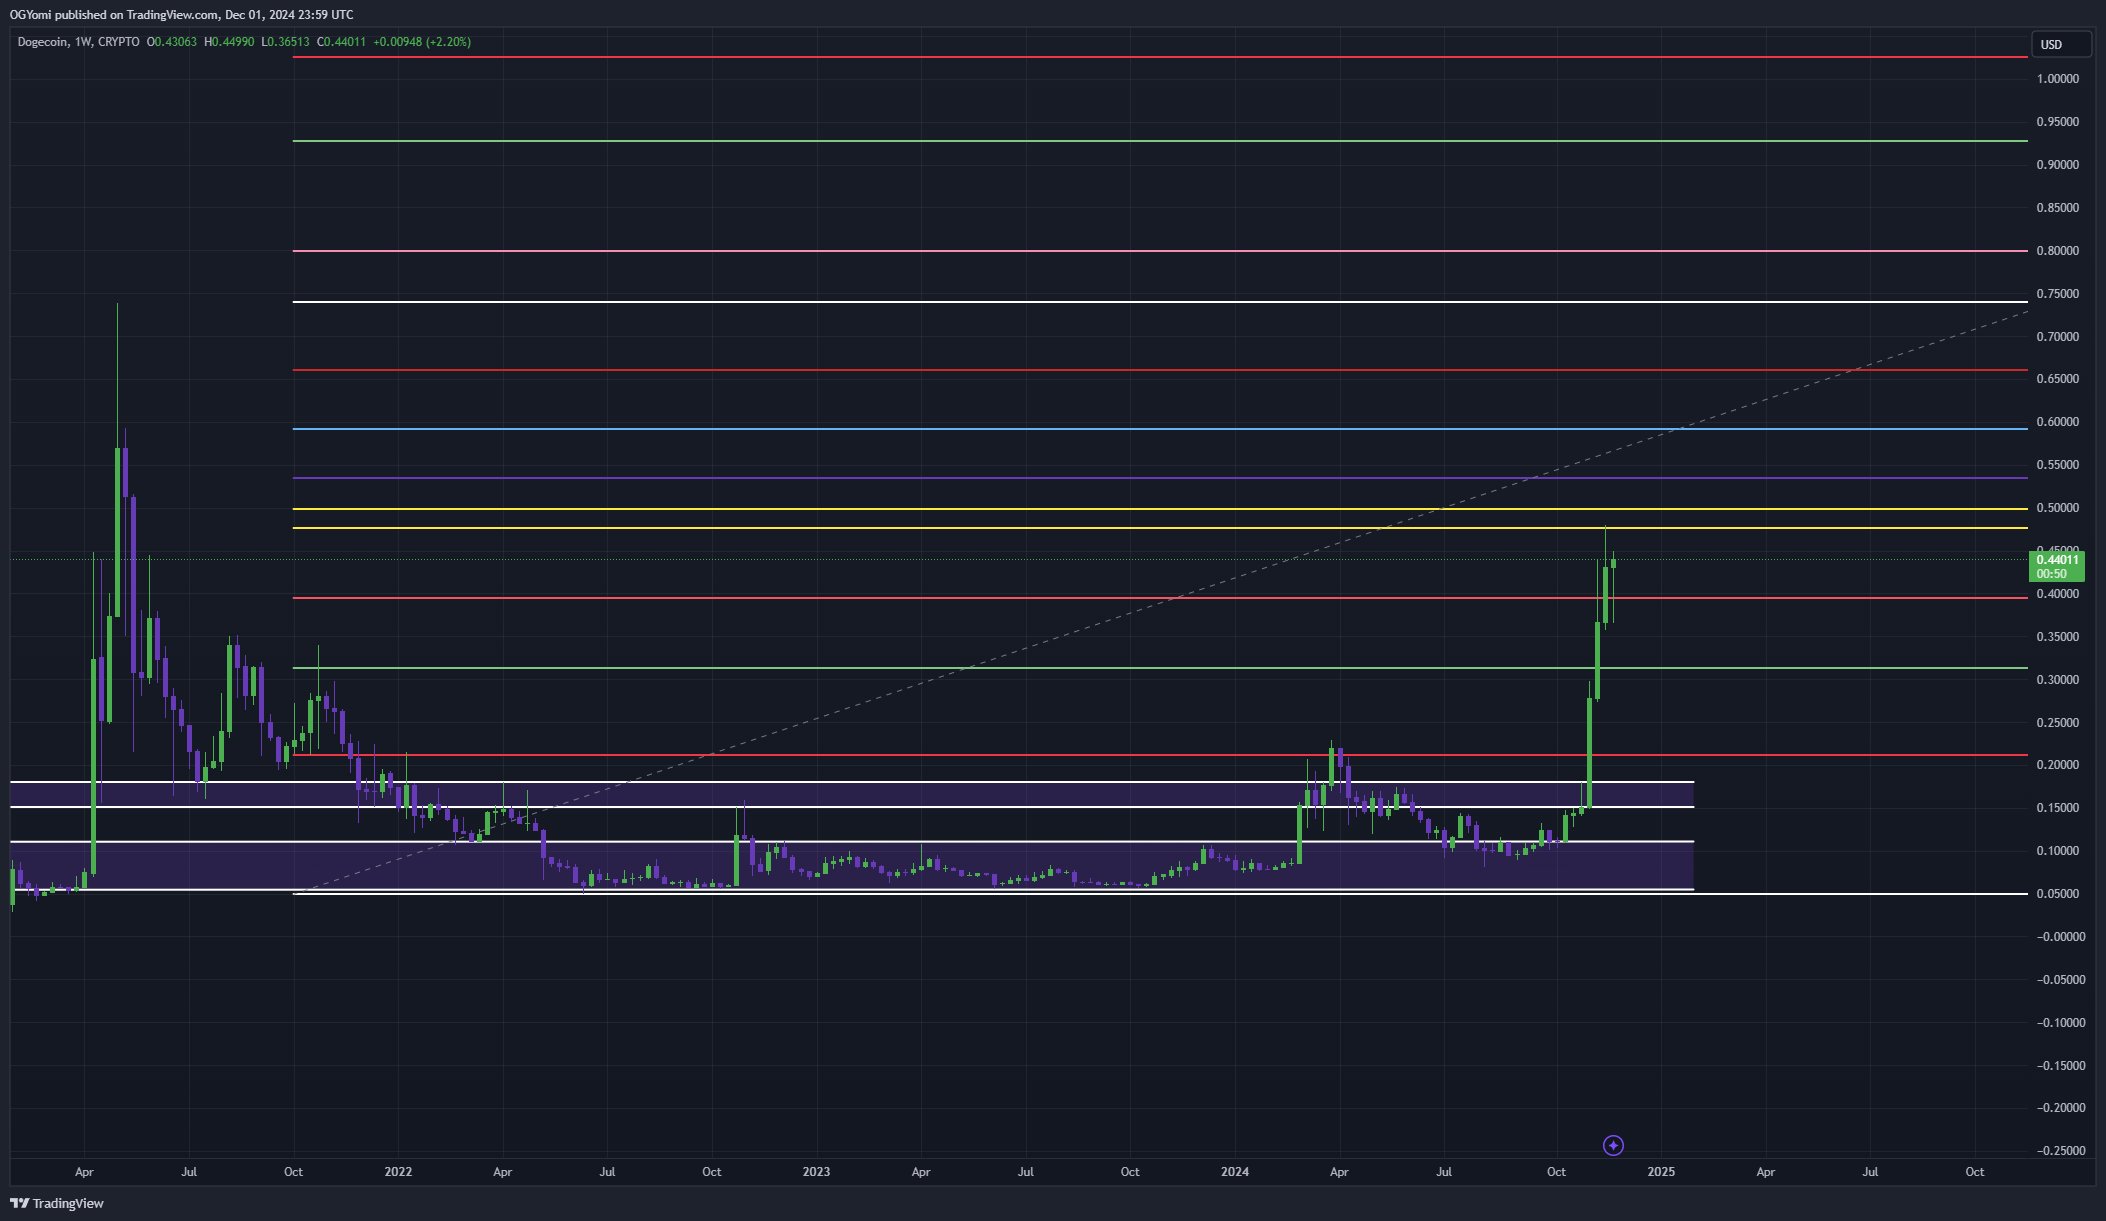
    Moreover, Kevin is closely looking at macroeconomic factors that could influence Dogecoin’s performance. He indicated that an “altcoin season” could serve as a catalyst for DOGE’s continued strength, contingent upon Bitcoin’s dominance falling below the 55% level. “If BTC Dominance breaks the 55% level cleanly you will get your #ALTSEASON folks,” he explained.

    Bitcoin dominance chart
    Bitcoin dominance chart | Source: @Kev_Capital_TA

    Additionally, Kevin shared his strategy regarding long-term moving averages, stating, “When these two long term moving averages cross on Dogecoin I will be selling a large piece of my bag. They have called the top successfully on DOGE multiple times. They are moving up fast!”

    Related Reading

    Notably, the crypto analyst is referring to the Pi Cycle Top Indicator for Dogecoin, a tool traditionally used for Bitcoin (BTC). This indicator relies on the crossing of two moving averages—the 111-day and the 350-day multiplied by two—to signal potential market peaks.

    Last week, Kevin revealed, “One of my secret indicators for Dogecoin that is traditionally only supposed to work for BTC is the Pi Cycle tops indicator. It has accurately called every DOGE cycle top and bottom over each of its cycles. When the two moving averages cross along with Monthly RSI being at a certain level that’s when I plan on taking significant portions out of the market.”

    At press time, DOGE traded at $0.41.

    Dogecoin price
    DOGE price, 1-week chart | Source: DOGEUSDT on TradingView.com

    Featured image created with DALL.E, chart from TradingView.com

    Source link

    Share. Facebook Twitter Pinterest LinkedIn Tumblr Email Copy Link
    Previous ArticleMost commodity prices to fall in 2025 from current levels, U.S. natural gas to outperform
    Next Article Walmart is selling a 'powerful' $170 cordless handheld vacuum for only $44 during Cyber Monday
    Anthony M. Orbison
    • Website

    Related Posts

    MARA Reports $214M In Q1 Revenue, Grows Bitcoin Holdings To 47,531 BTC

    May 8, 2025

    After New Hampshire, Arizona Joins Bitcoin Reserve Race

    May 8, 2025

    Bitcoin rallies above $101,000 as US state level strategic reserves and mass adoption accelerate

    May 8, 2025
    Leave A Reply Cancel Reply

    Amazon.com, Inc.
    $192.08
    $3.37
    1.79%
    Meta Platforms, Inc.
    $598.01
    $1.20
    0.20%
    S&P 500
    $5,663.94
    $32.66
    0.58%
    Alphabet Inc.
    $155.75
    $2.95
    1.93%
    EUR/USD
    $1.12
    $0.0000
    0.00%
    EUR/JPY
    $163.83
    $1.23
    0.76%
    USD/CAD
    $1.39
    $0.0001
    0.01%

    Risk Disclosure: Trading in financial instruments and/or cryptocurrencies involves high risks including the risk of losing some, or all, of your investment amount, and may not be suitable for all investors. Prices of cryptocurrencies are extremely volatile and may be affected by external factors such as financial, regulatory or political events. Trading on margin increases the financial risks.
    Before deciding to trade in financial instrument or cryptocurrencies you should be fully informed of the risks and costs associated with trading the financial markets, carefully consider your investment objectives, level of experience, and risk appetite, and seek professional advice where needed.
    Fusion Media would like to remind you that the data contained in this website is not necessarily real-time nor accurate. The data and prices on the website are not necessarily provided by any market or exchange, but may be provided by market makers, and so prices may not be accurate and may differ from the actual price at any given market, meaning prices are indicative and not appropriate for trading purposes. Fusion Media and any provider of the data contained in this website will not accept liability for any loss or damage as a result of your trading, or your reliance on the information contained within this website.
    It is prohibited to use, store, reproduce, display, modify, transmit or distribute the data contained in this website without the explicit prior written permission of Fusion Media and/or the data provider. All intellectual property rights are reserved by the providers and/or the exchange providing the data contained in this website.
    Fusion Media may be compensated by the advertisers that appear on the website, based on your interaction with the advertisements or advertisers.
    We're social. Connect with us:

    Facebook X (Twitter)
    • Home
    • About us
    • Contact
    • Disclaimer
    • Privacy Policy
    © 2025 Marketsnews.co.uk

    Type above and press Enter to search. Press Esc to cancel.