Close Menu
    What's Hot

    KULR Technology Group Announces $300 Million ATM Offering To Invest In Their Bitcoin Treasury

    Bitcoin fractal, boost in HODLers hints at rally to $120K

    BlackRock’s IShares Bitcoin Trust Shatters ETF Growth Record, Surpassing $70 Billion In Just 341 Days

    Facebook X (Twitter) Instagram
    MarketsNews.co.uk
    • Live Chart
    • Brokers
    • Scam Broker
    • Reviews
    • Tools
      • Lot Size Calculator
      • Margin Calculator
      • PIPS Calculator
      • Profit & loss calculator
    Facebook X (Twitter) Instagram
    Start Trading
    Trending Topics:
    • Markets
    • Stocks
    • Cryptocurrency
    • Forex
    • Scam Broker
    MarketsNews.co.uk
    • Markets
    • Stocks
    • Cryptocurrency
    • Forex
    • Scam Broker
    Cryptocurrency

    XRP Slides After Failing To Reclaim $2.9, What’s Next For Bulls?

    Anthony M. OrbisonBy Anthony M. OrbisonDecember 9, 2024No Comments3 Mins Read
    Share Facebook Twitter Pinterest Copy Link Telegram LinkedIn Tumblr Email
    Share
    Facebook Twitter LinkedIn Pinterest Email

    XRP’s upward momentum has taken a hit after the price failed to reclaim its previous high of $2.9, sparking a fresh decline that has resulted in the price dropping toward previous support levels. The rejection has raised questions about the strength of the bulls and whether they can regain control to steer the price back to higher levels.

    Bearish Build-Up On The 4-Hour Timeframe

    With bearish pressure mounting, the focus now shifts to key support zones and whether the bulls can hold firm against the downside movement, preventing XRP from experiencing a much deeper correction.

    On the 4-hour chart, XRP exhibits negative sentiment, attempting to drop below the 100-day Simple Moving Average (SMA) as it trends downward toward the $1.9 support level. Specifically, a continued descent to this support suggests that selling pressure is intensifying, and if the support fails to hold, the asset could experience more declines.

    Also, an analysis of the 4-hour chart reveals that the Composite Trend Oscillator’s trend line has fallen below the SMA line, signaling a potential shift in momentum as it edges closer to the zero line. This indicates a struggle to sustain upward movements and points to moderate bearish pressure, leading to a cautious market sentiment. If the signal line continues to drop, it may trigger heightened selling activity.

    Price Set Up For XRP On The 1-Day Timeframe

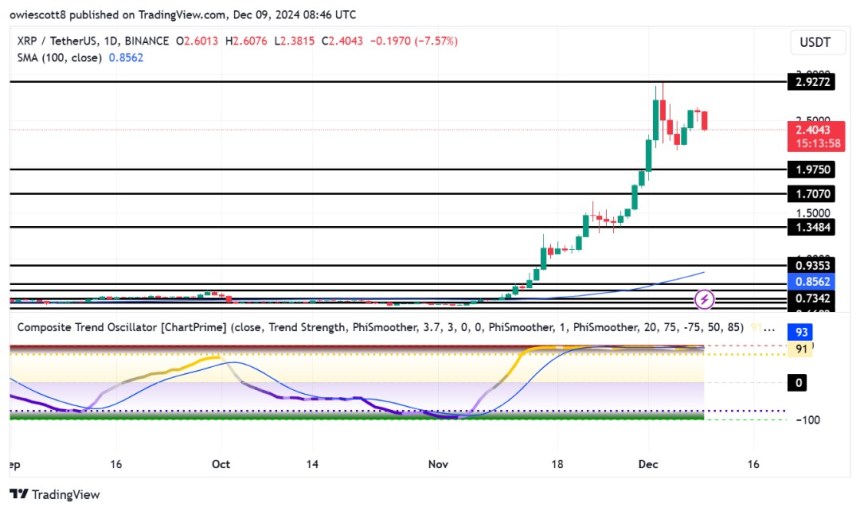
    On the daily chart, the crypto giant displays significant downward movement, highlighted by a bearish candlestick after a failed recovery attempt to surge toward its previous high of $2.9. The inability to sustain an uptrend implies a lack of buyer confidence and a prevailing pessimistic sentiment in the market. As XRP aims at the $1.9 support level, the pressure from sellers could intensify, raising concerns about the possibility of a breakdown.
    XRP

    Finally, the 1-day Composite Trend Oscillator signals growing bearish momentum, with the indicator’s signal line dropping below the SMA after lingering in the overbought zone. This development suggests a possible shift in market dynamics as the overbought conditions may give way to increased selling pressure. A crossover of the signal line below the SMA is often interpreted as a bearish signal, indicating that the upside momentum could be weakening.

    Related Reading: XRP Price Steadies Above Support: Preparing for the Next Move?

    Conclusively, as XRP faces renewed negative pressure, key support levels become crucial in determining its next move. Meanwhile, the first level to watch is $1.9, which could act as an initial buffer against further declines. A sustained break below this level might open the door for a deeper drop toward $1.7, a region of significant historical activity. If bearish momentum persists, the $1.3 mark could serve as the last line of defense before a broader selloff ensues.

    XRP

    Source link

    Share. Facebook Twitter Pinterest LinkedIn Tumblr Email Copy Link
    Previous ArticleEngland house prices ‘affordable’ only for richest 10% in 2022-23
    Next Article Equity exposure is not extreme, Deutsche Bank analysts say By Investing.com
    Anthony M. Orbison
    • Website

    Related Posts

    KULR Technology Group Announces $300 Million ATM Offering To Invest In Their Bitcoin Treasury

    June 9, 2025

    Bitcoin fractal, boost in HODLers hints at rally to $120K

    June 9, 2025

    BlackRock’s IShares Bitcoin Trust Shatters ETF Growth Record, Surpassing $70 Billion In Just 341 Days

    June 9, 2025
    Leave A Reply Cancel Reply

    Amazon.com, Inc.
    $216.98
    $3.41
    1.60%
    Meta Platforms, Inc.
    $694.06
    $3.65
    0.52%
    S&P 500
    $6,005.88
    $5.52
    0.09%
    Alphabet Inc.
    $177.63
    $2.92
    1.67%
    EUR/USD
    $1.14
    $0.0027
    0.24%
    EUR/JPY
    $165.05
    $0.0000
    0.00%
    USD/CAD
    $1.37
    $0.0009
    0.07%

    Risk Disclosure: Trading in financial instruments and/or cryptocurrencies involves high risks including the risk of losing some, or all, of your investment amount, and may not be suitable for all investors. Prices of cryptocurrencies are extremely volatile and may be affected by external factors such as financial, regulatory or political events. Trading on margin increases the financial risks.
    Before deciding to trade in financial instrument or cryptocurrencies you should be fully informed of the risks and costs associated with trading the financial markets, carefully consider your investment objectives, level of experience, and risk appetite, and seek professional advice where needed.
    Fusion Media would like to remind you that the data contained in this website is not necessarily real-time nor accurate. The data and prices on the website are not necessarily provided by any market or exchange, but may be provided by market makers, and so prices may not be accurate and may differ from the actual price at any given market, meaning prices are indicative and not appropriate for trading purposes. Fusion Media and any provider of the data contained in this website will not accept liability for any loss or damage as a result of your trading, or your reliance on the information contained within this website.
    It is prohibited to use, store, reproduce, display, modify, transmit or distribute the data contained in this website without the explicit prior written permission of Fusion Media and/or the data provider. All intellectual property rights are reserved by the providers and/or the exchange providing the data contained in this website.
    Fusion Media may be compensated by the advertisers that appear on the website, based on your interaction with the advertisements or advertisers.
    We're social. Connect with us:

    Facebook X (Twitter)
    • Home
    • About us
    • Contact
    • Disclaimer
    • Privacy Policy
    © 2025 Marketsnews.co.uk

    Type above and press Enter to search. Press Esc to cancel.