Close Menu
    What's Hot

    Blockchain Group to Raise $340M for Bitcoin Treasury

    Illegal Mining and Policy Gaps Stall Malaysia’s Crypto Growth

    Bitcoin Price Support at $100,000 Becomes the Key Level to Defend

    Facebook X (Twitter) Instagram
    MarketsNews.co.uk
    • Live Chart
    • Brokers
    • Scam Broker
    • Reviews
    • Tools
      • Lot Size Calculator
      • Margin Calculator
      • PIPS Calculator
      • Profit & loss calculator
    Facebook X (Twitter) Instagram
    Start Trading
    Trending Topics:
    • Markets
    • Stocks
    • Cryptocurrency
    • Forex
    • Scam Broker
    MarketsNews.co.uk
    • Markets
    • Stocks
    • Cryptocurrency
    • Forex
    • Scam Broker
    Cryptocurrency

    Bitcoin On Track For $275,000? Analyst Cites Cup And Handle Formation

    Anthony M. OrbisonBy Anthony M. OrbisonDecember 12, 2024No Comments3 Mins Read
    Share Facebook Twitter Pinterest Copy Link Telegram LinkedIn Tumblr Email
    Share
    Facebook Twitter LinkedIn Pinterest Email

    Este artículo también está disponible en español.

    Bitcoin (BTC) fell to $94,500 yesterday after Microsoft shareholders decisively rejected a Bitcoin treasury proposal to allocate 1% of the company’s total assets to buy BTC as an inflation hedge. However, analysts are still confident of further appreciation of the BTC price.

    Bitcoin May Surge As High As $275,000

    According to data from Coinglass, over $478 million worth of contracts – primarily long positions – were liquidated in the past 24 hours following the plunge in BTC and other cryptocurrencies. Interestingly, liquidation volumes were higher in altcoins compared to Bitcoin.

    Related Reading

    However, some analysts view this price dip as a buying opportunity. Seasoned crypto analyst Ali Martinez took to X to highlight a long cup and handle pattern forming on Bitcoin’s weekly chart.

    For those unfamiliar, the cup and handle pattern is a bullish technical formation that resembles a rounded “cup” followed by a brief consolidation period or “handle.” It typically signals the potential for a continuation of an uptrend, often leading to significant price gains.

    Martinez noted that the pattern suggests Bitcoin could surge as high as $275,000, based on its technical structure. However, he also urged traders to exercise caution and avoid overleveraging their positions.

    Source: ali_charts on X

    On the other hand, prominent crypto analyst @Trader_XO warned that Bitcoin must maintain its support at $90,000 to avoid further downside. Should BTC lose this critical level, it could drop as low as $85,000. Conversely, holding above $90,000 would allow the cryptocurrency to rebound and resume its uptrend.

    BTC Takes Another Jab At Breaking Through $100,000

    Despite yesterday’s dip, Bitcoin recovered swiftly, trading near $100,000 at the time of writing. The flagship cryptocurrency has remained in an overall uptrend, likely bolstered by today’s US inflation data for November, which largely aligned with market expectations.

    Related Reading

    Bitcoin recently hit a new all-time high (ATH) of $103,679, according to data from CoinGecko. However, its price has fluctuated above and below the pivotal $100,000 mark, leading to over $1.5 billion in liquidations in the past week.

    Several factors could drive Bitcoin’s price to a new ATH. For instance, BTC reserves on cryptocurrency exchanges have hit multi-year lows, reflecting rising demand for the digital asset.

    American financier and former investment banker Anthony Scaramucci recently predicted China might establish its own Bitcoin reserve if the US proceeds with its strategic Bitcoin reserve plans. National BTC reserves are expected to reinforce Bitcoin’s supply scarcity narrative, potentially driving prices higher.

    At the same time, BTC adoption among corporations continues to rise, as Canadian video-sharing firm Rumble became the latest company to unveil a BTC treasury strategy. BTC trades at $100,453 at press time, up 4.1% in the past 24 hours.

    bitcoin
    BTC trades at $100,453 on the daily chart | Source: BTCUSDT on TradingView.com

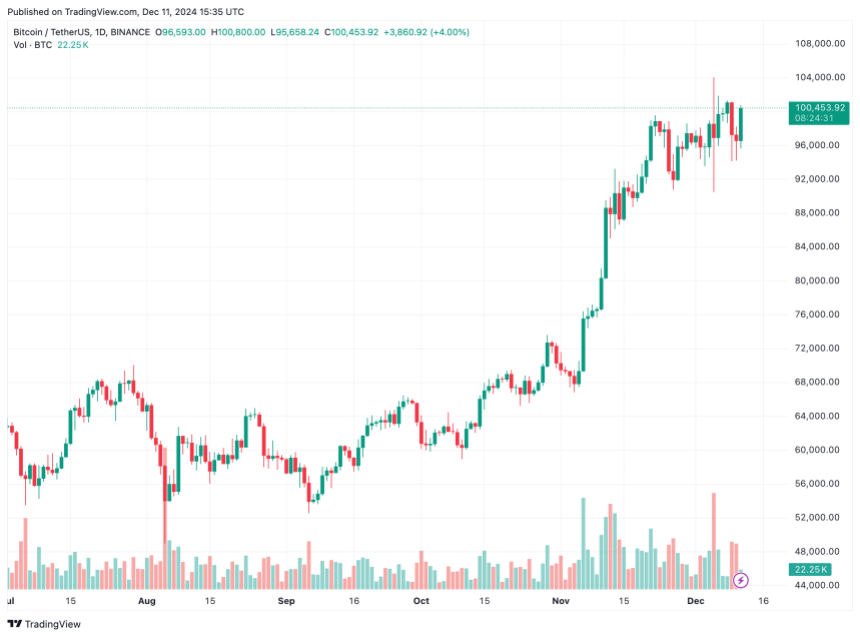
    Featured image from Unsplash, Charts from X and TradingView.com

    Source link

    Share. Facebook Twitter Pinterest LinkedIn Tumblr Email Copy Link
    Previous ArticleECB, Swiss set to cut, but by how much?
    Next Article Google wants government agency to kill AI competitor's deal
    Anthony M. Orbison
    • Website

    Related Posts

    Blockchain Group to Raise $340M for Bitcoin Treasury

    June 9, 2025

    Illegal Mining and Policy Gaps Stall Malaysia’s Crypto Growth

    June 9, 2025

    Bitcoin Price Support at $100,000 Becomes the Key Level to Defend

    June 9, 2025
    Leave A Reply Cancel Reply

    Amazon.com, Inc.
    $213.57
    $5.66
    2.72%
    Meta Platforms, Inc.
    $697.71
    $13.09
    1.91%
    S&P 500
    $6,000.36
    $61.06
    1.03%
    Alphabet Inc.
    $174.92
    $5.11
    3.01%
    EUR/USD
    $1.14
    $0.0025
    0.22%
    EUR/JPY
    $164.63
    $0.42
    0.25%
    USD/CAD
    $1.37
    $0.0014
    0.10%

    Risk Disclosure: Trading in financial instruments and/or cryptocurrencies involves high risks including the risk of losing some, or all, of your investment amount, and may not be suitable for all investors. Prices of cryptocurrencies are extremely volatile and may be affected by external factors such as financial, regulatory or political events. Trading on margin increases the financial risks.
    Before deciding to trade in financial instrument or cryptocurrencies you should be fully informed of the risks and costs associated with trading the financial markets, carefully consider your investment objectives, level of experience, and risk appetite, and seek professional advice where needed.
    Fusion Media would like to remind you that the data contained in this website is not necessarily real-time nor accurate. The data and prices on the website are not necessarily provided by any market or exchange, but may be provided by market makers, and so prices may not be accurate and may differ from the actual price at any given market, meaning prices are indicative and not appropriate for trading purposes. Fusion Media and any provider of the data contained in this website will not accept liability for any loss or damage as a result of your trading, or your reliance on the information contained within this website.
    It is prohibited to use, store, reproduce, display, modify, transmit or distribute the data contained in this website without the explicit prior written permission of Fusion Media and/or the data provider. All intellectual property rights are reserved by the providers and/or the exchange providing the data contained in this website.
    Fusion Media may be compensated by the advertisers that appear on the website, based on your interaction with the advertisements or advertisers.
    We're social. Connect with us:

    Facebook X (Twitter)
    • Home
    • About us
    • Contact
    • Disclaimer
    • Privacy Policy
    © 2025 Marketsnews.co.uk

    Type above and press Enter to search. Press Esc to cancel.