Close Menu
    What's Hot

    Blockchain Group to Raise $340M for Bitcoin Treasury

    Illegal Mining and Policy Gaps Stall Malaysia’s Crypto Growth

    Bitcoin Price Support at $100,000 Becomes the Key Level to Defend

    Facebook X (Twitter) Instagram
    MarketsNews.co.uk
    • Live Chart
    • Brokers
    • Scam Broker
    • Reviews
    • Tools
      • Lot Size Calculator
      • Margin Calculator
      • PIPS Calculator
      • Profit & loss calculator
    Facebook X (Twitter) Instagram
    Start Trading
    Trending Topics:
    • Markets
    • Stocks
    • Cryptocurrency
    • Forex
    • Scam Broker
    MarketsNews.co.uk
    • Markets
    • Stocks
    • Cryptocurrency
    • Forex
    • Scam Broker
    Cryptocurrency

    XRP Price Flashes Falling Wedge Pattern, Why $2.8 Is A Possible Target From Here

    Anthony M. OrbisonBy Anthony M. OrbisonDecember 12, 2024No Comments3 Mins Read
    Share Facebook Twitter Pinterest Copy Link Telegram LinkedIn Tumblr Email
    Share
    Facebook Twitter LinkedIn Pinterest Email

    Este artículo también está disponible en español.

    A Falling Wedge pattern has emerged on the XRP price chart, fueling speculation of a bullish reversal to new highs. According to a crypto analyst, XRP could reach three potential new price targets if it can break out of the Falling Wedge, with $2.8 being the highest target.   

    Falling Wedge To Trigger XRP Price Surge To $2.8

    The XRP price has been on a powerful uptrend in the past month, jumping from $0.5 to over $2 in just one month. Acknowledging this impressive performance, a crypto analyst on TradingView, known as ‘MBM_Crypto,’ has revealed that the XRP price has undergone a pullback and is currently “cooling off” in a Falling Wedge pattern after experiencing its massive upside move.

    Related Reading

    A Falling Wedge is a technical chart pattern that indicates a potential price reversal to the upside. Typically seen as a bullish signal, this pattern often appears during a downtrend, featuring two converging trend lines sloping downwards.   

    Source: X

    The TradingView analyst shared a chart detailing the XRP price action in a 2-hour time frame, highlighting the presence of a Falling Wedge pattern. The chart pointed out key areas where XRP is likely to encounter selling pressure, resistance, and indicate optimal buying levels for investors.  

    The analyst suggests that purchasing XRP when its price breaks above $2.51 could be a strategic move, indicating a potential for a bullish breakout following the conclusion of its current consolidation phase. Additionally, he shared key take-profit targets for investors, suggesting that XRP was on track to potentially hit three bullish price milestones if it successfully breaks out of its Falling Wedge pattern. 

    The first target for XRP is $2.6, followed by the second projected leap to $2.7, while the third and highest target is positioned at $2.8. For the XRP price to achieve these key price levels, the TradingView analyst has suggested that it will have to break above the blue resistance zone at $2.42, thus confirming a potential bullish continuation for the cryptocurrency.

    While the analyst is confident about his optimistic price projection, he has also acknowledged the possibility of a temporary pullback to $2.15 or even $1.96. Following this price correction, the crypto expert believes that XRP could eventually break out of the Falling Wedge and take off.  

    Analyst Says XRP Is ”Super Bullish”

    Despite trading at $2.4 after experiencing a slight decline in the past weeks, analysts remain highly optimistic about XRP’s future price prospects. Dark Defender, a prominent crypto analyst on X (formerly Twitter), has declared that the XRP price is “super bullish” during this cycle.

    Related Reading

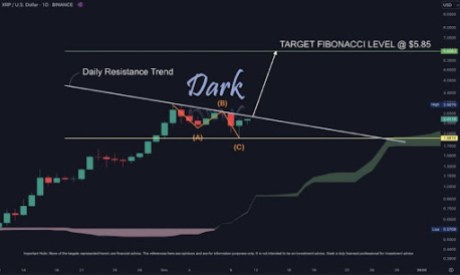
    The analyst observed that XRP is on the verge of finalizing the ABC Corrective Wave pattern in the daily time frame, signaling a potential reversal and the beginning of an uptrend. This pattern will be confirmed once XRP breaks the $2.52 level.
    XRP Price 2
    Source: X

    Dark Defender has forecasted that the XRP price could exceed this level within 24 hours, triggering a path to the $5.85 target before potentially skyrocketing to $18.22. 

    XRP price chart from Tradingview.com
    Price struggles to maintain bullish momentum | Source: XRPUSDT on Tradingview.com

    Featured image created with Dall.E, chart from Tradingview.com

    Source link

    Share. Facebook Twitter Pinterest LinkedIn Tumblr Email Copy Link
    Previous ArticleCasey Caruso raised $75 million for Topology Ventures
    Next Article Cathie Wood sells $7 million of surging stock
    Anthony M. Orbison
    • Website

    Related Posts

    Blockchain Group to Raise $340M for Bitcoin Treasury

    June 9, 2025

    Illegal Mining and Policy Gaps Stall Malaysia’s Crypto Growth

    June 9, 2025

    Bitcoin Price Support at $100,000 Becomes the Key Level to Defend

    June 9, 2025
    Leave A Reply Cancel Reply

    Amazon.com, Inc.
    $213.57
    $5.66
    2.72%
    Meta Platforms, Inc.
    $697.71
    $13.09
    1.91%
    S&P 500
    $6,000.36
    $61.06
    1.03%
    Alphabet Inc.
    $174.92
    $5.11
    3.01%
    EUR/USD
    $1.14
    $0.0033
    0.29%
    EUR/JPY
    $164.57
    $0.481
    0.29%
    USD/CAD
    $1.37
    $0.0018
    0.13%

    Risk Disclosure: Trading in financial instruments and/or cryptocurrencies involves high risks including the risk of losing some, or all, of your investment amount, and may not be suitable for all investors. Prices of cryptocurrencies are extremely volatile and may be affected by external factors such as financial, regulatory or political events. Trading on margin increases the financial risks.
    Before deciding to trade in financial instrument or cryptocurrencies you should be fully informed of the risks and costs associated with trading the financial markets, carefully consider your investment objectives, level of experience, and risk appetite, and seek professional advice where needed.
    Fusion Media would like to remind you that the data contained in this website is not necessarily real-time nor accurate. The data and prices on the website are not necessarily provided by any market or exchange, but may be provided by market makers, and so prices may not be accurate and may differ from the actual price at any given market, meaning prices are indicative and not appropriate for trading purposes. Fusion Media and any provider of the data contained in this website will not accept liability for any loss or damage as a result of your trading, or your reliance on the information contained within this website.
    It is prohibited to use, store, reproduce, display, modify, transmit or distribute the data contained in this website without the explicit prior written permission of Fusion Media and/or the data provider. All intellectual property rights are reserved by the providers and/or the exchange providing the data contained in this website.
    Fusion Media may be compensated by the advertisers that appear on the website, based on your interaction with the advertisements or advertisers.
    We're social. Connect with us:

    Facebook X (Twitter)
    • Home
    • About us
    • Contact
    • Disclaimer
    • Privacy Policy
    © 2025 Marketsnews.co.uk

    Type above and press Enter to search. Press Esc to cancel.