Close Menu
    What's Hot

    Michael Saylor Labels Quantum Threat Bitcoin As Hype

    TRON: Who’s fueling TRX’s breakout? It’s not whales, here’s the answer!

    Arca Dumps Circle Shares After Disappointing IPO Allocation

    Facebook X (Twitter) Instagram
    MarketsNews.co.uk
    • Live Chart
    • Brokers
    • Scam Broker
    • Reviews
    • Tools
      • Lot Size Calculator
      • Margin Calculator
      • PIPS Calculator
      • Profit & loss calculator
    Facebook X (Twitter) Instagram
    Start Trading
    Trending Topics:
    • Markets
    • Stocks
    • Cryptocurrency
    • Forex
    • Scam Broker
    MarketsNews.co.uk
    • Markets
    • Stocks
    • Cryptocurrency
    • Forex
    • Scam Broker
    Cryptocurrency

    Polygon’s bull flag emerges as activity dips: Should buyers be cautious?

    Anthony M. OrbisonBy Anthony M. OrbisonDecember 13, 2024No Comments3 Mins Read
    Share Facebook Twitter Pinterest Copy Link Telegram LinkedIn Tumblr Email
    Share
    Facebook Twitter LinkedIn Pinterest Email
    • POL appears to have formed a bull flag on its four-hour chart suggesting an upcoming uptrend.
    • This uptrend could face resistance given that a majority of holders are yet to become profitable. 

    Polygon [POL] traded at $0.655 at press time, after an 11% gain in 24 hours. These gains are a reversal from bearish trends, given that the price remains down by 7% in the last seven days. 

    Polygon, like most altcoins, recorded a strong uptrend in late November, before hitting a snag earlier this month. This uptrend and the subsequent drop formed a bull flag on POL’s four-hour chart. 

    This pattern suggests that POL could continue its uptrend, but more buying volumes are needed to support a breakout.
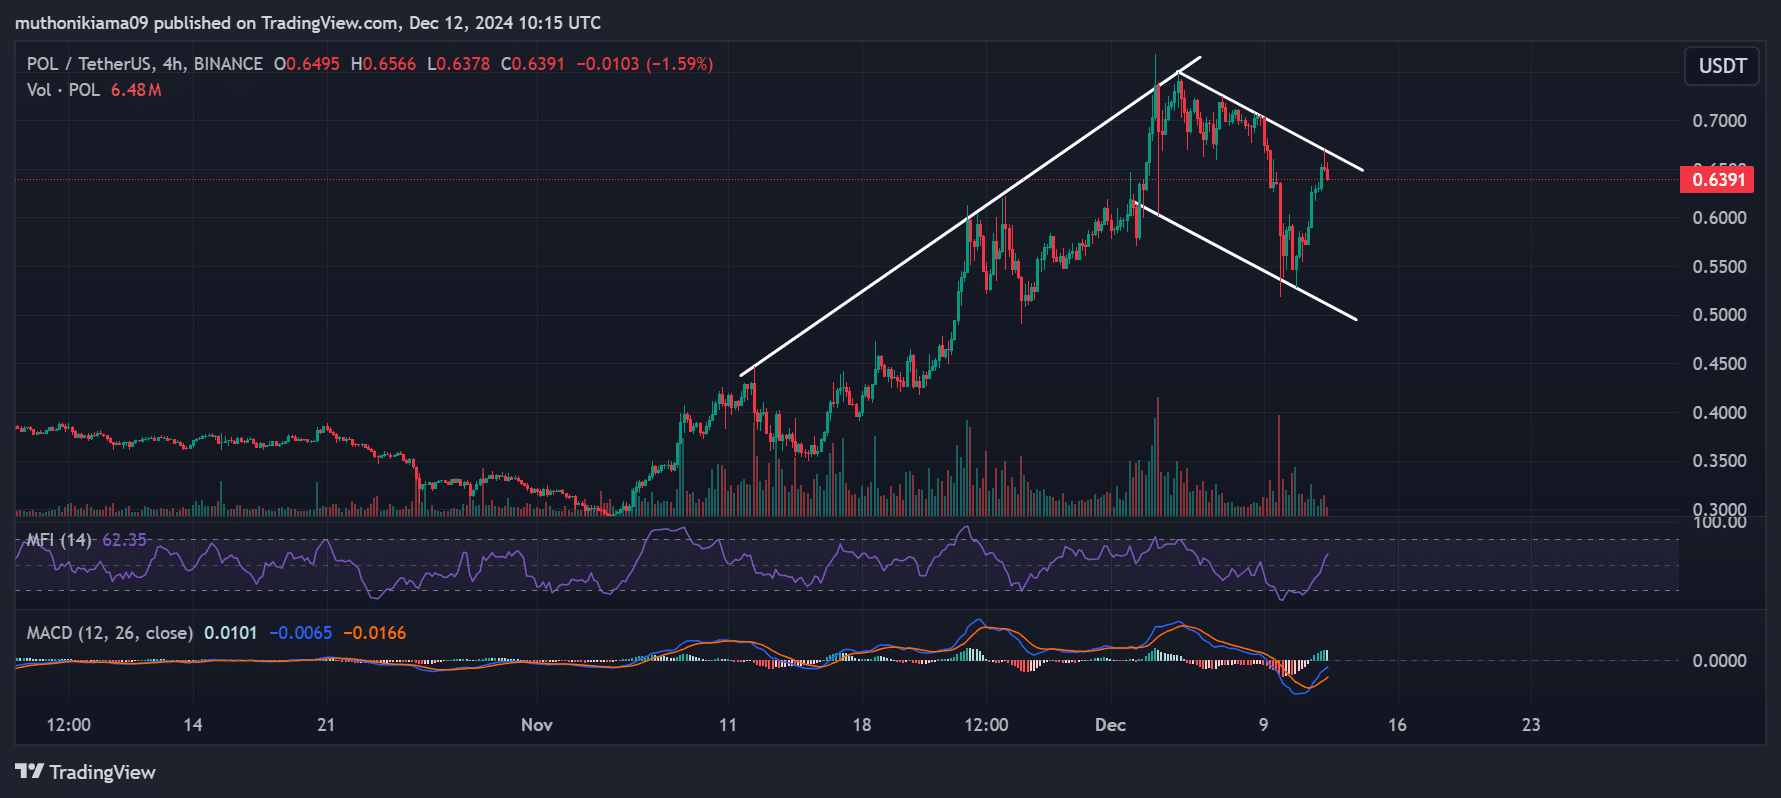
    Source: Tradingview

    The volume histogram bars depict minimal buying and selling activity. However, the Money Flow Index (MFI) index suggests that buying activity is increasing after a rise to 62. 

    The Moving Average Convergence Divergence (MACD) also shows that bulls are regaining control after the MACD histogram bars flipped green, an indication of rising buying activity. 

    At the same time, the MACD line on this lower timeframe is in an uptrend, and if it crosses above the signal line, it will be a confirmation of short-term bullishness. 

    Key levels to watch 

    The In/Out of the Money Around Price (IOMAP) metric from IntoTheBlock shows that nearly 10,000 addresses bought POL between $0.65 and $0.67. This price zone could act as a support level, with a drop below set to cause a downturn. 

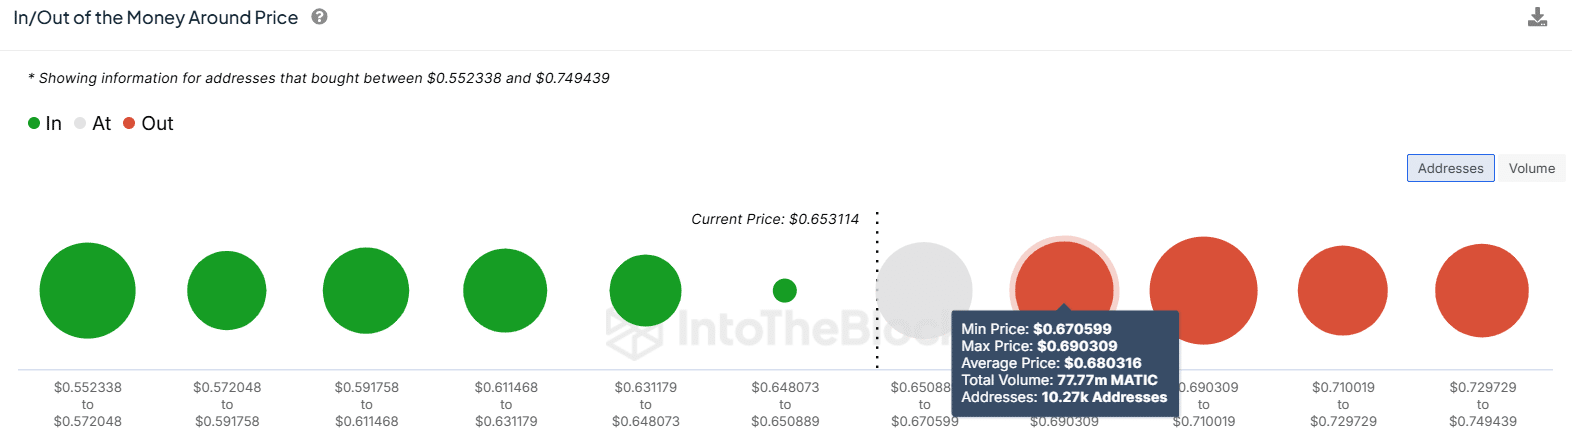
    Source: IntoTheBlock

    The other cohort to watch is the 10,270 addresses that bought more than 31M POL tokens between $0.67 and $0.69. This zone could act as a strong resistance level as these addresses could begin to sell once they become profitable. 

    Polygon’s dApp activity could impact price 

    Data from DappRadar shows a notable drop of more than 8% in Polygon’s seven-day dApp volumes, which stood at $2.41 billion at press time. The Unique Active Wallets (UAWs) also dropped by 10%. 
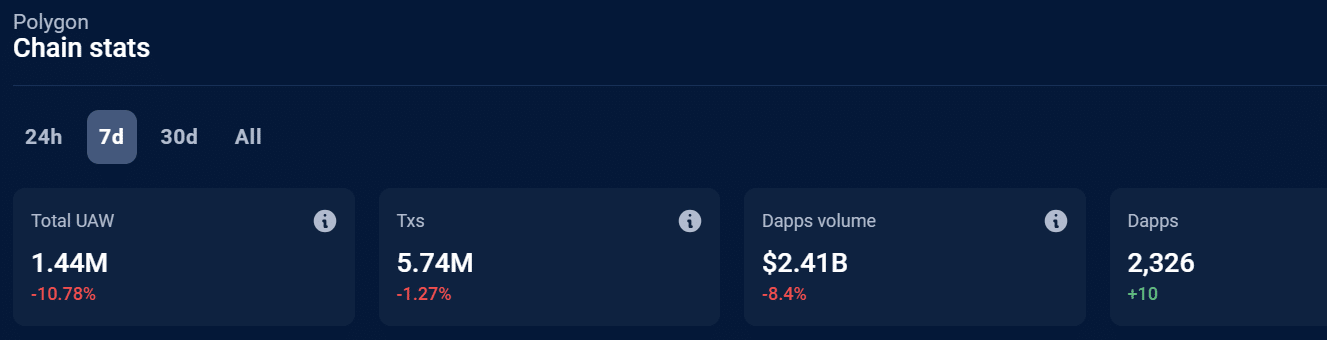
    Source: DappRadar

    However, on the decentralized finance (DeFi) front, Polygon has staged a strong recovery, with the Total Value Locked (TVL) surging to $1.195 billion per DeFiLlama. The TVL is now at its highest level in more than one month. 

    If the Polygon network continues to show strength and growth, it could bode well for POL. 


    Is your portfolio green? Check out the POL Profit Calculator


    Long/short ratio shows a shift in sentiment 

    Polygon’s long/short ratio dropped to a monthly low of 0.79 on the 9th of December after a rise in short-selling activity. However, this ratio has since surged to 0.90. 
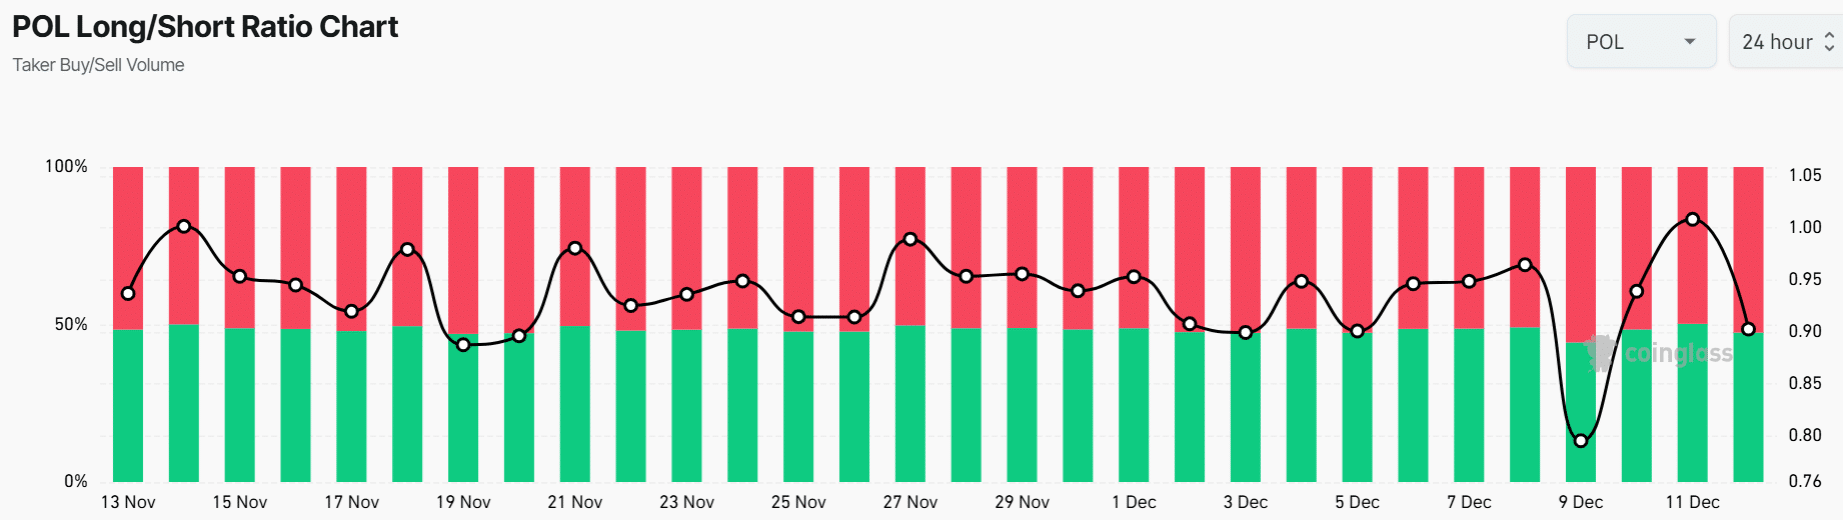
    Source: Coinglass

    POL’s long/short ratio still shows bearish sentiment, given that 52% of traders are short sellers. This indicates that there are fewer traders who are optimistic about a continued uptrend.

    Next: ALGO: As bullish crossover emerges, where will the altcoin head next?

    Source link

    Share. Facebook Twitter Pinterest LinkedIn Tumblr Email Copy Link
    Previous ArticleWatch These Broadcom Price Levels as Stock Soars on Strong AI Sales Growth
    Next Article SEC ‘reopens’ probe into Neuralink, Musk’s lawyer says By Reuters
    Anthony M. Orbison
    • Website

    Related Posts

    Michael Saylor Labels Quantum Threat Bitcoin As Hype

    June 9, 2025

    TRON: Who’s fueling TRX’s breakout? It’s not whales, here’s the answer!

    June 9, 2025

    Arca Dumps Circle Shares After Disappointing IPO Allocation

    June 9, 2025
    Leave A Reply Cancel Reply

    Amazon.com, Inc.
    $213.57
    $5.66
    2.72%
    Meta Platforms, Inc.
    $697.71
    $13.09
    1.91%
    S&P 500
    $6,000.36
    $61.06
    1.03%
    Alphabet Inc.
    $174.92
    $5.11
    3.01%
    EUR/USD
    $1.14
    $0.0027
    0.24%
    EUR/JPY
    $164.82
    $0.235
    0.14%
    USD/CAD
    $1.37
    $0.0003
    0.02%

    Risk Disclosure: Trading in financial instruments and/or cryptocurrencies involves high risks including the risk of losing some, or all, of your investment amount, and may not be suitable for all investors. Prices of cryptocurrencies are extremely volatile and may be affected by external factors such as financial, regulatory or political events. Trading on margin increases the financial risks.
    Before deciding to trade in financial instrument or cryptocurrencies you should be fully informed of the risks and costs associated with trading the financial markets, carefully consider your investment objectives, level of experience, and risk appetite, and seek professional advice where needed.
    Fusion Media would like to remind you that the data contained in this website is not necessarily real-time nor accurate. The data and prices on the website are not necessarily provided by any market or exchange, but may be provided by market makers, and so prices may not be accurate and may differ from the actual price at any given market, meaning prices are indicative and not appropriate for trading purposes. Fusion Media and any provider of the data contained in this website will not accept liability for any loss or damage as a result of your trading, or your reliance on the information contained within this website.
    It is prohibited to use, store, reproduce, display, modify, transmit or distribute the data contained in this website without the explicit prior written permission of Fusion Media and/or the data provider. All intellectual property rights are reserved by the providers and/or the exchange providing the data contained in this website.
    Fusion Media may be compensated by the advertisers that appear on the website, based on your interaction with the advertisements or advertisers.
    We're social. Connect with us:

    Facebook X (Twitter)
    • Home
    • About us
    • Contact
    • Disclaimer
    • Privacy Policy
    © 2025 Marketsnews.co.uk

    Type above and press Enter to search. Press Esc to cancel.