Close Menu
    What's Hot

    Spot Ethereum ETFs post 14-day inflow run, lifting year-to-date haul above $3B

    Bitcoin At A Crossroads: $97,000 Cost Basis Holds Key To Next Breakout

    Bitcoin Leveraged Traders Are Back Betting On A Price Decline — What This Means

    Facebook X (Twitter) Instagram
    MarketsNews.co.uk
    • Live Chart
    • Brokers
    • Scam Broker
    • Reviews
    • Tools
      • Lot Size Calculator
      • Margin Calculator
      • PIPS Calculator
      • Profit & loss calculator
    Facebook X (Twitter) Instagram
    Start Trading
    Trending Topics:
    • Markets
    • Stocks
    • Cryptocurrency
    • Forex
    • Scam Broker
    MarketsNews.co.uk
    • Markets
    • Stocks
    • Cryptocurrency
    • Forex
    • Scam Broker
    Cryptocurrency

    Traders, ApeCoin’s Bull Flag pattern is likely to play out THIS way!

    Anthony M. OrbisonBy Anthony M. OrbisonDecember 15, 2024No Comments3 Mins Read
    Share Facebook Twitter Pinterest Copy Link Telegram LinkedIn Tumblr Email
    Share
    Facebook Twitter LinkedIn Pinterest Email
    • Bull flag pattern pointed to breakout towards altcoin’s $2.168 resistance
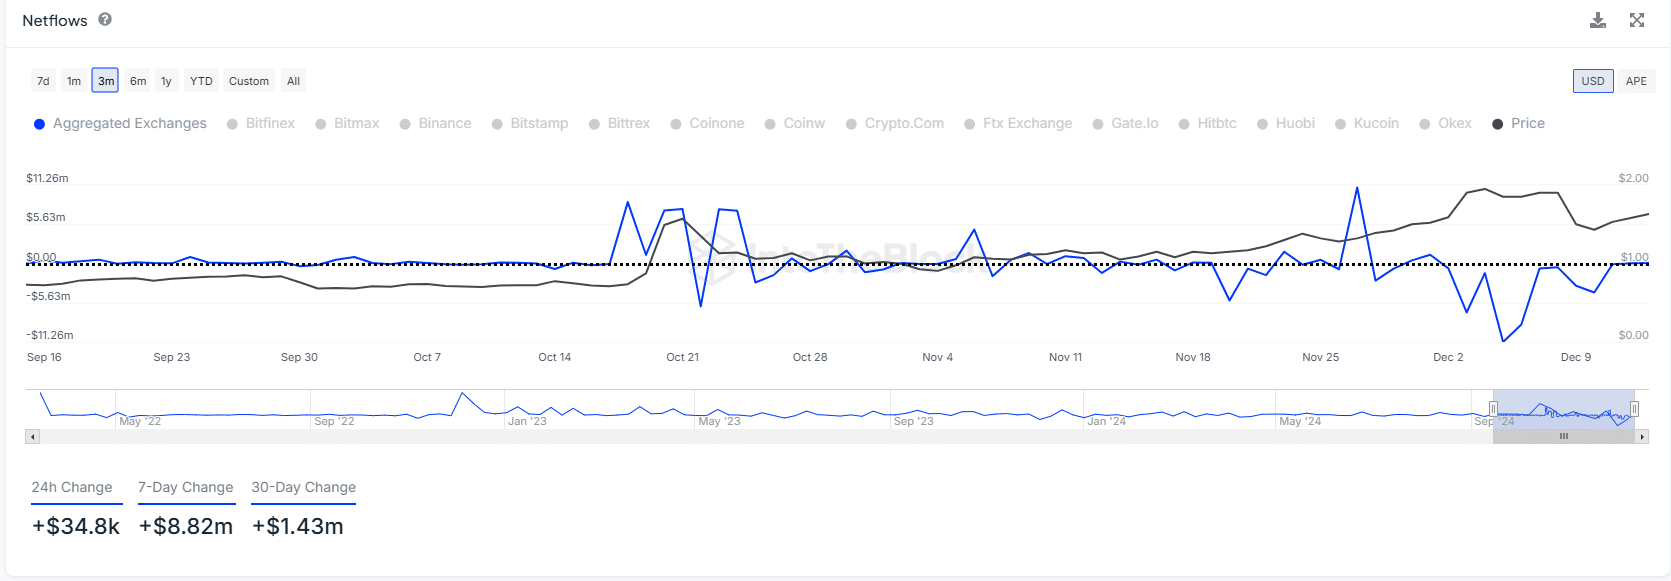
    • At press time, netflows revealed a positive change of +$34.8k in just 24 hours

    ApeCoin has shown promising signs of growth recently, fueled by a hike in market activity and bullish technical indicators. In fact, the altcoin’s price rose by 3.24% in 24 hours to trade at $1.61, at the time of writing.  

    On the metrics front, a surge in large transaction volumes and positive netflows indicated strengthening market sentiment. On the other hand, a bull flag pattern on the charts alluded to a breakout towards higher resistance levels.

     As a result, many ApeCoin traders are now anticipating a hike in the altcoin’s value in the near term.

    Large transaction volume continues to surge

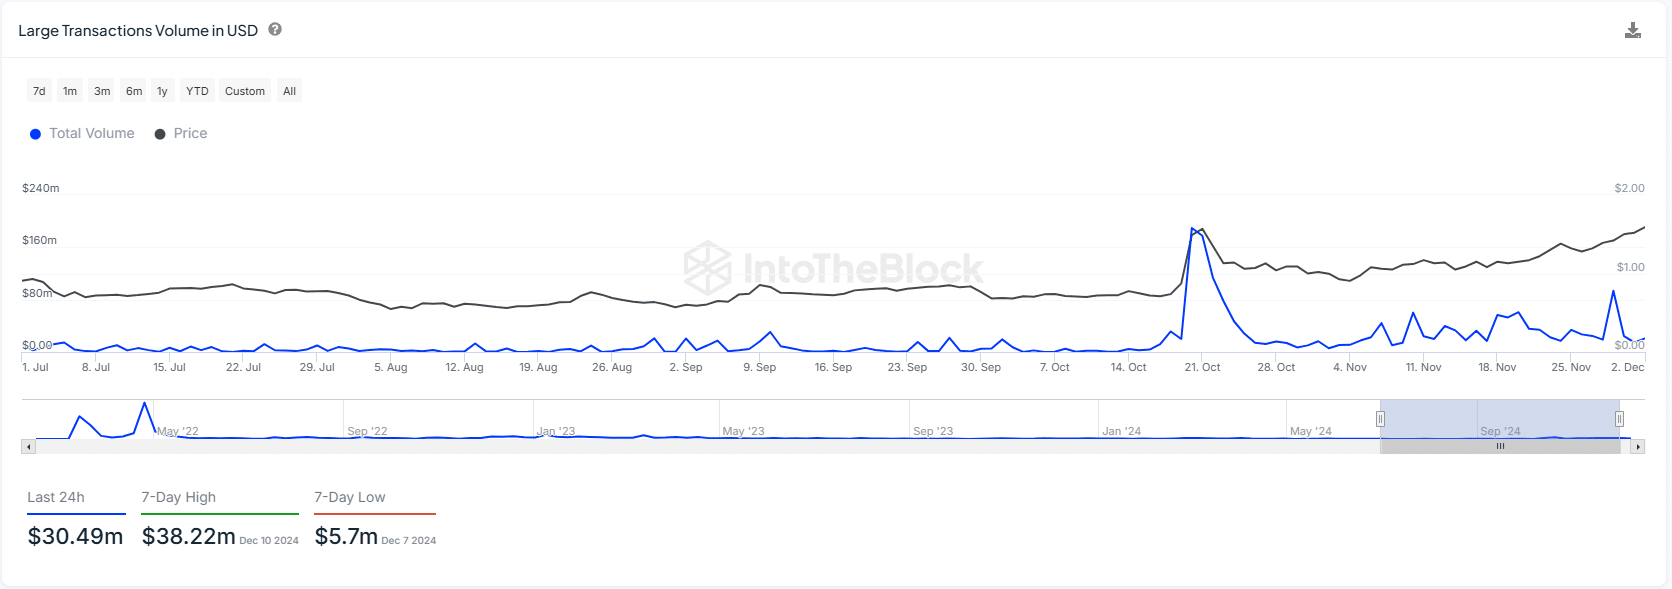
    ApeCoin’s recent performance has been marked by large transaction volumes, signaling strong investor interest. In the last 24 hours alone, large transactions amounted to $30.49 million, with a peak of $38.22 million on 10 December.

    Source: IntoTheBlock

     Over the last few months, the token has consistently attracted large trades, showing greater attention from institutional and high-volume investors.

     This growing market interest has likely contributed to the steady hike in ApeCoin’s price, especially in late October and early December.

    ApeCoin netflows underline growing confidence

    The uptick in ApeCoin’s netflows further emphasized the growing confidence in the token. Over the aforementioned period, netflows saw a positive change of +$34.8k, with a significant hike of +$8.82 million over the past week. 

    These movements are a sign of greater demand for the altcoin, especially as more investors are now moving funds into ApeCoin. 

    Source: IntoTheBlock

    The larger trend over the past month revealed netflows totaling +$1.43 million – A figure which strongly aligns with the price hike, reinforcing the optimistic outlook for ApeCoin.

    Bull Flag pattern points to breakout

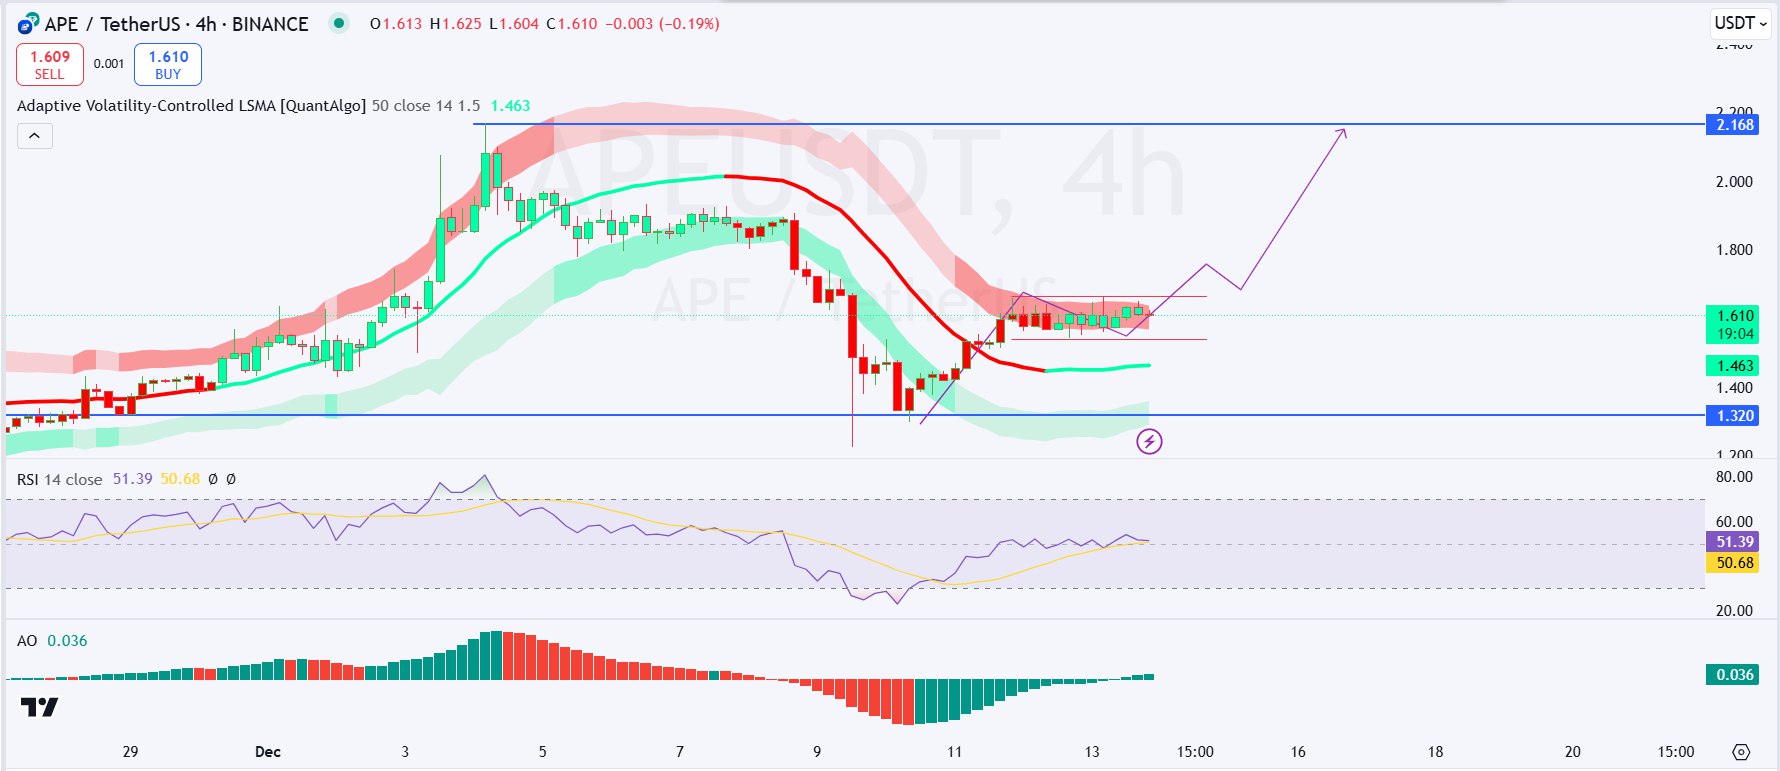
    At the time of writing, technical indicators were also signaling a bullish outlook for ApeCoin. For instance, the 4-hour chart highlighted a classic bull flag pattern, one showing that a breakout may occur. The flagpole is followed by a period of consolidation, where the price stabilizes before breaking above key resistance levels. 

     The Adaptive Volatility-Controlled LSMA at $1.463 has been acting as a dynamic support zone, keeping the structure intact for a breakout.

    If ApeCoin breaks above $1.66, this would confirm the continuation of the uptrend.

    Source: Tradingview

    The Relative Strength Index (RSI) stood at 51.39, showing neutral momentum with no signs of overbought or oversold conditions, leaving room for more gains. Additionally, the Awesome Oscillator (AO) flashed green bars – A sign of mild positive momentum.

     If this pattern holds, the price could climb towards the $2.168 resistance level. However, a breakdown below $1.54 could signal a bearish reversal to the $1.32 major support level.

    Long/Short ratio’s analysis

    An analysis of the long/short ratio for ApeCoin also supported the case for an upward move. The ratio recently rose to 1.10, indicating that long positions have been outweighing short positions. 

    Source: Coinglass

    This shift in sentiment is a sign of growing bullish confidence in ApeCoin’s short-term prospects. 

    While the market sentiment remains fluid, a higher long-to-short ratio indicates strong buying interest. This could push ApeCoin’s price higher if the trend sustains itself.

    Next: Solana – Can VanEck’s SOL to $500 price prediction come true?

    Source link

    Share. Facebook Twitter Pinterest LinkedIn Tumblr Email Copy Link
    Previous ArticlePeter Hargreaves’ Blue Whale sells major tech stocks over AI concerns
    Next Article Investing.com’s stocks of the week By Investing.com
    Anthony M. Orbison
    • Website

    Related Posts

    Spot Ethereum ETFs post 14-day inflow run, lifting year-to-date haul above $3B

    June 8, 2025

    Bitcoin At A Crossroads: $97,000 Cost Basis Holds Key To Next Breakout

    June 8, 2025

    Bitcoin Leveraged Traders Are Back Betting On A Price Decline — What This Means

    June 8, 2025
    Leave A Reply Cancel Reply

    Amazon.com, Inc.
    $213.57
    $5.66
    2.72%
    Meta Platforms, Inc.
    $697.71
    $13.09
    1.91%
    S&P 500
    $6,000.36
    $61.06
    1.03%
    Alphabet Inc.
    $174.92
    $5.11
    3.01%
    EUR/USD
    $1.14
    $0.0056
    0.49%
    EUR/JPY
    $165.05
    $0.774
    0.47%
    USD/CAD
    $1.37
    $0.0019
    0.14%

    Risk Disclosure: Trading in financial instruments and/or cryptocurrencies involves high risks including the risk of losing some, or all, of your investment amount, and may not be suitable for all investors. Prices of cryptocurrencies are extremely volatile and may be affected by external factors such as financial, regulatory or political events. Trading on margin increases the financial risks.
    Before deciding to trade in financial instrument or cryptocurrencies you should be fully informed of the risks and costs associated with trading the financial markets, carefully consider your investment objectives, level of experience, and risk appetite, and seek professional advice where needed.
    Fusion Media would like to remind you that the data contained in this website is not necessarily real-time nor accurate. The data and prices on the website are not necessarily provided by any market or exchange, but may be provided by market makers, and so prices may not be accurate and may differ from the actual price at any given market, meaning prices are indicative and not appropriate for trading purposes. Fusion Media and any provider of the data contained in this website will not accept liability for any loss or damage as a result of your trading, or your reliance on the information contained within this website.
    It is prohibited to use, store, reproduce, display, modify, transmit or distribute the data contained in this website without the explicit prior written permission of Fusion Media and/or the data provider. All intellectual property rights are reserved by the providers and/or the exchange providing the data contained in this website.
    Fusion Media may be compensated by the advertisers that appear on the website, based on your interaction with the advertisements or advertisers.
    We're social. Connect with us:

    Facebook X (Twitter)
    • Home
    • About us
    • Contact
    • Disclaimer
    • Privacy Policy
    © 2025 Marketsnews.co.uk

    Type above and press Enter to search. Press Esc to cancel.