Close Menu
    What's Hot

    A major Bitcoin short squeeze could happen if BTC price volatility returns

    Assessing Ethereum’s struggles: Why ETH must hold THIS support

    Spot Ether ETFs ongoing inflow streak has hit $812.2M inflows

    Facebook X (Twitter) Instagram
    MarketsNews.co.uk
    • Live Chart
    • Brokers
    • Scam Broker
    • Reviews
    • Tools
      • Lot Size Calculator
      • Margin Calculator
      • PIPS Calculator
      • Profit & loss calculator
    Facebook X (Twitter) Instagram
    Start Trading
    Trending Topics:
    • Markets
    • Stocks
    • Cryptocurrency
    • Forex
    • Scam Broker
    MarketsNews.co.uk
    • Markets
    • Stocks
    • Cryptocurrency
    • Forex
    • Scam Broker
    Markets

    Watch These Palantir Price Levels After Stock’s Nasdaq 100 Inclusion

    Anthony M. OrbisonBy Anthony M. OrbisonDecember 16, 2024No Comments3 Mins Read
    Share Facebook Twitter Pinterest Copy Link Telegram LinkedIn Tumblr Email
    Share
    Facebook Twitter LinkedIn Pinterest Email
    Source: TradingView.com
    • Palantir shares are likely to be in the spotlight on Monday after the Nasdaq announced late Friday that the analytics software provider had been added to the Nasdaq 100 Index.

    • The stock has continued to trend sharply higher after breaking out from a cup and handle pattern, though the relative strength index cautions overbought conditions that could lead to near-term price fluctuations.

    • The measuring principle, which calculates the percentage change to the cup and handle’s “cup” and adds it to the pattern’s top trendline value, projects a bullish price target of $140.07.

    • Investors should watch key lower levels on Palantir’s chart at $45 and a zone of support between $33 and $29.

    Palantir Technologies (PLTR) shares are likely to be in the spotlight on Monday after the Nasdaq announced late Friday that the analytics software provider, along with MicroStrategy (MSTR), and Axon Enterprise (AXON), had been added to the Nasdaq 100 Index.

    The stock’s inclusion into the tech-heavy benchmark comes after it has more than quadrupled from the start of the year as of Friday’s close, boosted by growing demand for the software maker’s customizable artificial intelligence (AI) offerings. The company’s shares became eligible to join the index following a strategic move to the Nasdaq from the New York Stock Exchange (NYSE) last month.

    Below, we break down the technicals on Palantir’s weekly chart and identify key price levels that investors may be watching out for.

    Since breaking out from a multi-year cup and handle pattern in August, Palantir shares have continued to trend sharply higher. Trading volumes have supported the move higher, indicating buying participation from larger market participants.

    The relative strength index (RSI) confirms bullish momentum, though the indicator’s elevated reading above 80 cautions overbought conditions, which could lead to near term-price fluctuations.

    Let’s apply technical analysis to project a longer-term bullish price target, while also pointing out key support levels that may attract buying interest during retracements.

    To forecast a potential bullish price target, investors can use the measuring principle, a chart-based technique that analyzes the cup and handle pattern to project a future move.

    When applying the method to Palantir’s chart, we calculate the percentage change to the cup and handle’s “cup” and add it to the pattern’s top trendline value. For instance, we add a 383% increase to $29, which projects a target of $140.07, around 85% above Palantir’s closing price on Friday.
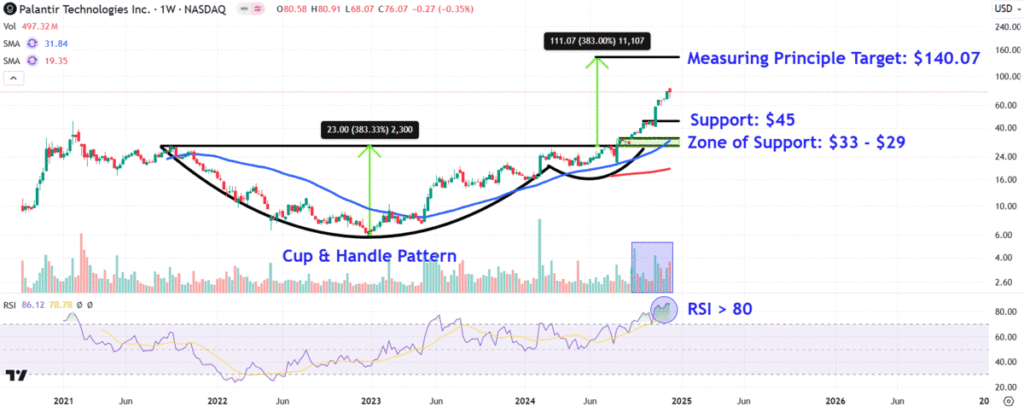
    If profit taking occurs, the stock initially could revisit support around $45, a location on the chart where investors may seek buying opportunities near a brief period of consolidation in the stock during October.

    Finally, selling below this level could trigger a fall into a zone of support between $33 and $29. This area on the chart would likely attract buying interest near the cup and handle pattern’s top trendline and the upward sloping 50-week moving average.

    The comments, opinions, and analyses expressed on Investopedia are for informational purposes only. Read our warranty and liability disclaimer for more info.

    As of the date this article was written, the author does not own any of the above securities.

    Read the original article on Investopedia

    Source link

    Share. Facebook Twitter Pinterest LinkedIn Tumblr Email Copy Link
    Previous ArticleAustralia stocks lower at close of trade; S&P/ASX 200 down 0.56% By Investing.com
    Next Article Will BTC Hit $120,000 Next?
    Anthony M. Orbison
    • Website

    Related Posts

    Where Analysts Think Bitcoin is Headed in 2025

    December 23, 2024

    Fed says it is weighing changes to bank tests for systemic risk

    December 23, 2024

    Housing crisis: Mobile home prices soar faster than single-family homes

    December 23, 2024
    Leave A Reply Cancel Reply

    Amazon.com, Inc.
    $213.57
    $5.66
    2.72%
    Meta Platforms, Inc.
    $697.71
    $13.09
    1.91%
    S&P 500
    $6,000.36
    $61.06
    1.03%
    Alphabet Inc.
    $174.92
    $5.11
    3.01%
    EUR/USD
    $1.14
    $0.0056
    0.49%
    EUR/JPY
    $165.05
    $0.774
    0.47%
    USD/CAD
    $1.37
    $0.0019
    0.14%

    Risk Disclosure: Trading in financial instruments and/or cryptocurrencies involves high risks including the risk of losing some, or all, of your investment amount, and may not be suitable for all investors. Prices of cryptocurrencies are extremely volatile and may be affected by external factors such as financial, regulatory or political events. Trading on margin increases the financial risks.
    Before deciding to trade in financial instrument or cryptocurrencies you should be fully informed of the risks and costs associated with trading the financial markets, carefully consider your investment objectives, level of experience, and risk appetite, and seek professional advice where needed.
    Fusion Media would like to remind you that the data contained in this website is not necessarily real-time nor accurate. The data and prices on the website are not necessarily provided by any market or exchange, but may be provided by market makers, and so prices may not be accurate and may differ from the actual price at any given market, meaning prices are indicative and not appropriate for trading purposes. Fusion Media and any provider of the data contained in this website will not accept liability for any loss or damage as a result of your trading, or your reliance on the information contained within this website.
    It is prohibited to use, store, reproduce, display, modify, transmit or distribute the data contained in this website without the explicit prior written permission of Fusion Media and/or the data provider. All intellectual property rights are reserved by the providers and/or the exchange providing the data contained in this website.
    Fusion Media may be compensated by the advertisers that appear on the website, based on your interaction with the advertisements or advertisers.
    We're social. Connect with us:

    Facebook X (Twitter)
    • Home
    • About us
    • Contact
    • Disclaimer
    • Privacy Policy
    © 2025 Marketsnews.co.uk

    Type above and press Enter to search. Press Esc to cancel.