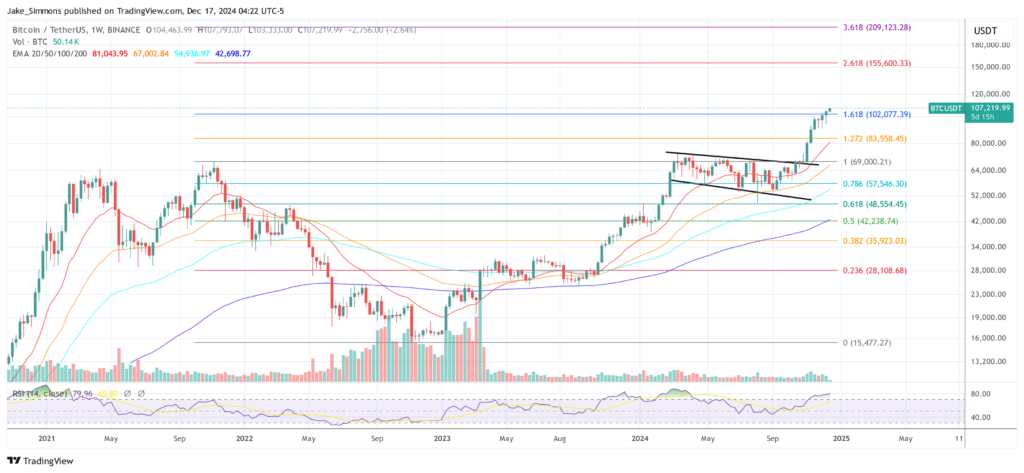
Bitcoin could soar to $180,000 in 2025 if key cycle top indicators remain muted, according to Matthew Sigel, Head of Digital Assets Research at VanEck. Speaking with podcast host Natalie Brunell, Sigel outlined a clear four-year pattern in Bitcoin’s price action that he believes has persisted through multiple market cycles.
Why $180,000 Per Bitcoin Seems Plausible
Sigel explained that Bitcoin tends to outperform nearly every other asset class for three years out of each four-year halving cycle, followed by a deep correction in the fourth year. Referencing a drawdown typically ranging from 60% to 80%, Sigel said this decline often arrives roughly two years after the BTC halving event.
Since Bitcoin’s most recent halving took place in April 2024, Sigel sees 2024 and 2025 as potentially strong years. “That down year typically is the second year after the halving,” Sigel explained. “The Bitcoin halving occurred in April of this year. So 2024 [will be a] strong year, 2025 should be a strong year. I think 2026, unless something changes, would be a down year.”
Related Reading
Drawing on historical data, he recalled the smallest trough-to-peak appreciation in Bitcoin’s previous cycles, which was approximately 2,000%. Even if that figure halves to 1,000%, Sigel pointed out that Bitcoin could rise from a trough of around $18,000 to as high as $180,000 in the current cycle. “So I see an upside to $180,000 this cycle, and I think that’s likely to happen next year,” Sigel added.
He also emphasized that Bitcoin’s volatility means the price could overshoot or undershoot that number, but that $180,000 represents a plausible target for 2024 if the pattern holds and no major “red light” indicators appear.
Sigel broke down what he sees as the most important topping signals for traders to watch. The first involves derivatives funding rates: if the annualized cost to hold bullish Bitcoin positions on leveraged markets pushes above 10% for longer than a couple of months, Sigel considers that a red flag.
“Some of those indicators include the funding rates. When the funding rate for Bitcoin exceeds 10% for more than a couple months, that tends to be a red light,” Sigel warned and explained that recent market activity reset elevated funding rates: “[Last week’s] washout eliminated that as well. So funding rates [are] not really flashing red.”
The second is the level of unrealized profits on the blockchain, where on-chain analysis can reveal whether market participants’ cost basis is so low that significant profit-taking might soon create selling pressure. “We’re not seeing scary amounts of unrealized profits [yet],” Sigel noted.
Finally, he said anecdotal evidence of widespread retail leverage or speculation could also flash warning lights. He explained that if all these risk indicators were to align at a certain price point—for example, if Bitcoin hit $150,000 and these metrics pointed to a market top—he would be cautious. However, he said that if the price reached around $180,000 without those signals appearing, there might still be room for further appreciation.
Related Reading
“If we reach $180K and none of those lights are flashing, maybe we let it run. If all those lights are flashing and the price is $150K, I’m not gonna wait,” Sigel added.
Next BTC Cycle Predictions
He also explored the longer-term growth potential for Bitcoin by comparing it to gold’s market capitalization. Because about half of gold’s supply is used for industrial and jewelry purposes, he reasoned that the other half can be compared more directly to Bitcoin’s function as an investment and store of value.
If Bitcoin were to reach a valuation comparable to that half portion of gold’s market cap, Sigel believes the price could trend toward roughly $450,000 per coin over the course of the next cycle.
Taking an even more forward-looking perspective, he described VanEck’s long-term model in which global central banks might eventually hold Bitcoin as part of their reserves, even if just at a 2% weighting. Since gold constitutes about 18% of central bank reserves worldwide, Sigel’s assumption is that Bitcoin’s share would be far smaller by comparison.
He also factored in the prospect that Bitcoin might one day serve as a settlement currency for global trade, potentially among emerging economic alliances such as the BRICS nations (Brazil, Russia, India, China, and South Africa), which could push its valuation significantly higher. In VanEck’s calculations, this scenario might place Bitcoin at $3 million per coin by 2050:
“We also assume that Bitcoin is used as a settlement currency for global trade, most likely among BRICS countries. We get to three million dollars a coin by 2050, which would be about a 16% compound annual growth rate.”
At press time, BTC traded at $107,219.
Featured image from YouTube / Natalie Brunell, chart from TradingView.com
