Close Menu
    What's Hot

    Chainlink Bullish Signal Stands Firm, But Bitcoin Is Calling The Shots

    Bitcoin Stabilizes at $104,000 Mid-Range as Market Eyes Next Breakout

    Solana whale unstakes $17M after 4 years – Should you be worried?

    Facebook X (Twitter) Instagram
    MarketsNews.co.uk
    • Live Chart
    • Brokers
    • Scam Broker
    • Reviews
    • Tools
      • Lot Size Calculator
      • Margin Calculator
      • PIPS Calculator
      • Profit & loss calculator
    Facebook X (Twitter) Instagram
    Start Trading
    Trending Topics:
    • Markets
    • Stocks
    • Cryptocurrency
    • Forex
    • Scam Broker
    MarketsNews.co.uk
    • Markets
    • Stocks
    • Cryptocurrency
    • Forex
    • Scam Broker
    Cryptocurrency

    Can Bulls Hold Key Support at $21.65?

    Anthony M. OrbisonBy Anthony M. OrbisonDecember 17, 2024No Comments3 Mins Read
    Share Facebook Twitter Pinterest Copy Link Telegram LinkedIn Tumblr Email
    Share
    Facebook Twitter LinkedIn Pinterest Email
    • INJ bulls held $21.65 support as analysts predict a potential 12x move to $380.
    • Futures Open Interest trended up, and trading volume jumped 9.54%, signaling strong market confidence.

     Injective [INJ]was trading at $27.77 at press time, showing a 0.46% decline over the last 24 hours and a 1.66% drop over the past week. 

    The 24-hour trading volume is $221.5 million, with a market cap of $2.73 billion and a circulating supply of 98 million INJ.

    The chart shows INJ breaking out of a prolonged downtrend after forming a rounded bottom pattern. This structure led to a strong rally, with buyers continuing to defend the $21.65 support level.
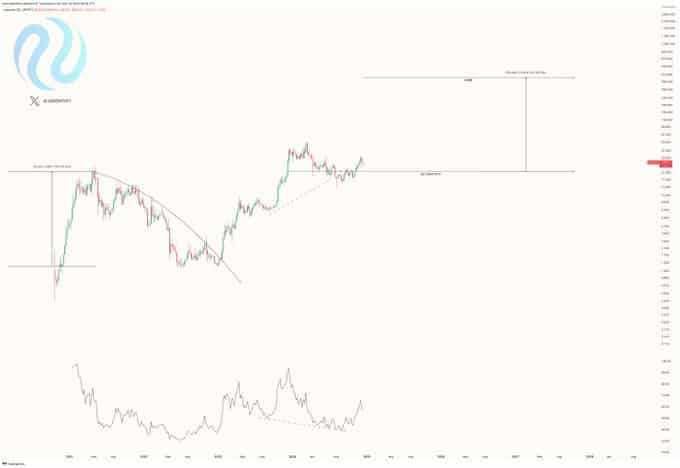
    Source: X

    Holding above this key support is essential to maintain the bullish continuation pattern.  Analysts point to a logarithmic price target of $380, a 12x gain from current levels if the trend remains intact.

    Technical indicators suggest mixed momentum

    Technical signals for INJ show mixed momentum. In November, the 13-day moving average (MA) crossed above the 49-day MA, forming a Golden Cross and signaling a bullish trend.

    However, the price has now dipped below the 13-day MA at $29.06 while staying above the 49-day MA. If the price fails to hold above the 49-day MA, the next key support is near $20.31.
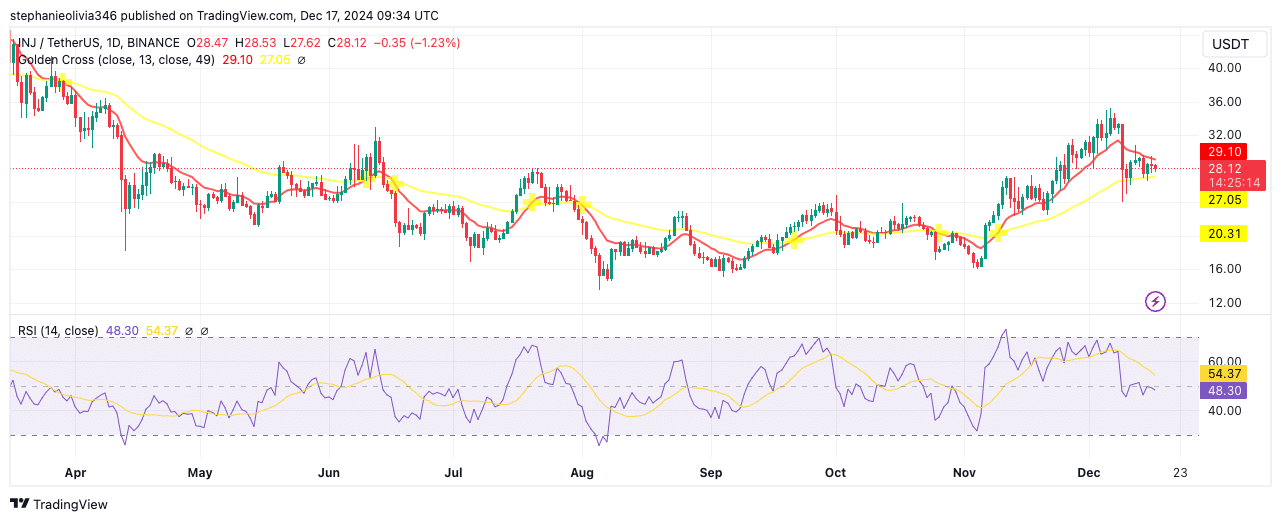
    Source: TradingView

    The Relative Strength Index (RSI) was at 47.63, showing neutral to bearish momentum as it stayed below 50. The downward slope in the RSI reflects weakening buying interest. 

    For buyers to regain control, the price would need to break back above the $29.06 resistance, with a potential upside toward $32 in the near term.

    On-chain data shows a drop in INJ’s activity

    Data from IntoTheBlock shows a decline in network engagement for Injective. For the week of December 16, there were 654 addresses, including 123 new addresses and 422 active addresses. 

    New addresses fell by 21.66%, while active addresses dropped 11.34% over the past seven days.

    Source: IntoTheBlock

    The slight rise of 1.87% in zero-balance addresses suggests some users may have moved funds or closed positions. While overall user activity has declined, the network’s fundamentals remain supported by existing users.

    Futures data shows steady market interest

    According to Coinglass, Open Interest (OI) for INJ futures is at $174.37 million, reflecting a 0.80% decline. This indicates mild profit-taking or reduced short-term activity. 

    However, OI has shown an upward trend since October, suggesting consistent participation from traders.
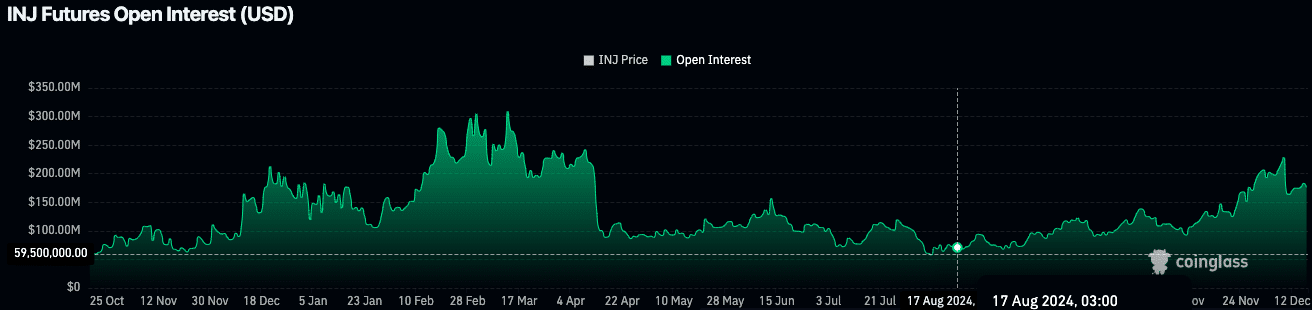
    Source: Coinglass


    Trading volume has increased by 9.54% to $271.95 million, showing ongoing interest in futures markets. 

    Rising trading volume, alongside steady open interest, points to sustained investor confidence in INJ.


    Read Injective’s [INJ] Price Prediction 2024–2025


    With technical patterns still in play, rising futures interest, and strong trading volume, INJ’s setup remains poised for further upward movement.

    Next: Chainlink- Analyzing the price impact of whale’s $2.95M withdrawal

    Source link

    Share. Facebook Twitter Pinterest LinkedIn Tumblr Email Copy Link
    Previous ArticleJapan’s Honda and Nissan to begin merger talks, Nikkei reports
    Next Article Nordstrom Rack is selling $200 Cole Haan sneakers for just $90, and shoppers say they're 'stylish and comfortable'
    Anthony M. Orbison
    • Website

    Related Posts

    Chainlink Bullish Signal Stands Firm, But Bitcoin Is Calling The Shots

    June 8, 2025

    Bitcoin Stabilizes at $104,000 Mid-Range as Market Eyes Next Breakout

    June 8, 2025

    Solana whale unstakes $17M after 4 years – Should you be worried?

    June 8, 2025
    Leave A Reply Cancel Reply

    Amazon.com, Inc.
    $213.57
    $5.66
    2.72%
    Meta Platforms, Inc.
    $697.71
    $13.09
    1.91%
    S&P 500
    $6,000.36
    $61.06
    1.03%
    Alphabet Inc.
    $174.92
    $5.11
    3.01%
    EUR/USD
    $1.14
    $0.0056
    0.49%
    EUR/JPY
    $165.05
    $0.774
    0.47%
    USD/CAD
    $1.37
    $0.0019
    0.14%

    Risk Disclosure: Trading in financial instruments and/or cryptocurrencies involves high risks including the risk of losing some, or all, of your investment amount, and may not be suitable for all investors. Prices of cryptocurrencies are extremely volatile and may be affected by external factors such as financial, regulatory or political events. Trading on margin increases the financial risks.
    Before deciding to trade in financial instrument or cryptocurrencies you should be fully informed of the risks and costs associated with trading the financial markets, carefully consider your investment objectives, level of experience, and risk appetite, and seek professional advice where needed.
    Fusion Media would like to remind you that the data contained in this website is not necessarily real-time nor accurate. The data and prices on the website are not necessarily provided by any market or exchange, but may be provided by market makers, and so prices may not be accurate and may differ from the actual price at any given market, meaning prices are indicative and not appropriate for trading purposes. Fusion Media and any provider of the data contained in this website will not accept liability for any loss or damage as a result of your trading, or your reliance on the information contained within this website.
    It is prohibited to use, store, reproduce, display, modify, transmit or distribute the data contained in this website without the explicit prior written permission of Fusion Media and/or the data provider. All intellectual property rights are reserved by the providers and/or the exchange providing the data contained in this website.
    Fusion Media may be compensated by the advertisers that appear on the website, based on your interaction with the advertisements or advertisers.
    We're social. Connect with us:

    Facebook X (Twitter)
    • Home
    • About us
    • Contact
    • Disclaimer
    • Privacy Policy
    © 2025 Marketsnews.co.uk

    Type above and press Enter to search. Press Esc to cancel.