In the world of Bitcoin investing, understanding market cycles is key to identifying buying opportunities and spotting potential price peaks. One indicator that has stood the test of time in this regard is the Puell Multiple. Originally created by David Puell, this metric examines Bitcoin’s valuation through the lens of miner revenue, offering insights into whether Bitcoin might be undervalued or overvalued compared to its historical norms.
This article will explain what the Puell Multiple is, how to interpret it, and what the current reading on the chart suggests for investors. For a real-time look at this tool, check out the Puell Multiple chart on Bitcoin Magazine Pro.
What is the Puell Multiple?
The Puell Multiple is an indicator that compares Bitcoin miners’ daily revenue to its long-term average. Miners, as the “supply side” of Bitcoin’s economy, must sell portions of their BTC rewards to cover operational costs like energy and hardware. This makes miner revenue a critical factor influencing Bitcoin’s price dynamics.
How is the Puell Multiple Calculated?
The formula is simple:
Puell Multiple = Daily Issuance Value of BTC (in USD) ÷ 365-Day Moving Average of Daily Issuance Value
By comparing current miner revenues to their yearly average, the Puell Multiple identifies periods where miner profits are unusually high or low, signaling potential market tops or bottoms.
How to Read the Puell Multiple Chart
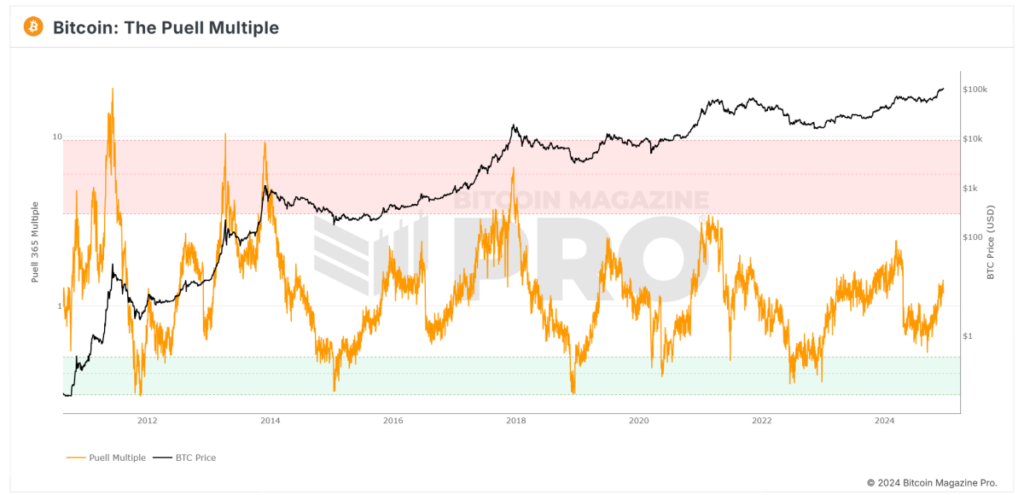
The Puell Multiple chart uses color zones to make interpretation straightforward:
- Red Zone (Overvaluation)
- When the Puell Multiple enters the red zone (above 3.4), it suggests miner revenues are significantly higher than usual.
- Historically, this has coincided with Bitcoin price peaks, indicating potential overvaluation.
- Green Zone (Undervaluation)
- When the Puell Multiple drops into the green zone (below 0.5), it signals that miner revenues are unusually low.
- These periods have historically aligned with Bitcoin market bottoms, offering prime buying opportunities.
- Neutral Zone
- When the Puell Multiple hovers between these levels, Bitcoin’s price is typically in a steady range relative to historical norms.
Current Insights: What is the Puell Multiple Telling Us?
Looking at the current Puell Multiple chart from Bitcoin Magazine Pro:
- The Puell Multiple (orange line) is trending upward but remains well below the red overvaluation zone.
- This suggests that Bitcoin is not yet in an overheated phase, where prices historically peak.
- At the same time, the metric is far above the green undervaluation zone, signaling we are no longer in a market bottom phase.
What Does This Mean for Investors?
The current Puell Multiple reading points to Bitcoin being in a mid-market cycle:
- Bullish Momentum: With the metric rising steadily, the market appears to be moving into a bullish phase, though it remains far from “overheated.”
- No Immediate Peak: The lack of a red zone reading suggests there may still be room for upside growth before a major correction.
Investors should monitor this chart closely in the coming months, particularly as Bitcoin approaches its next halving event in 2028, which could further influence miner revenues.
Why the Puell Multiple Matters for Bitcoin Investors
The Puell Multiple offers a unique perspective on Bitcoin’s market cycles by focusing on the supply side (miner revenue), rather than just demand. For long-term investors, this tool can be valuable for:
- Identifying Buying Opportunities: The green zone highlights periods of undervaluation.
- Spotting Market Peaks: The red zone has historically aligned with major price tops.
- Navigating Market Cycles: Combining the Puell Multiple with other indicators can help investors time their entries and exits more strategically.
Stay Ahead of the Market with Bitcoin Magazine Pro
For professional investors and Bitcoin enthusiasts looking to deepen their analysis, tools like the Puell Multiple chart on Bitcoin Magazine Pro provide essential insights into Bitcoin’s valuation trends.
By understanding the Puell Multiple and its historical significance, you can make informed decisions and better navigate Bitcoin’s unique market cycles.
Disclaimer: This article is for informational purposes only and does not constitute financial advice. Always conduct your own research before making investment decisions.
