Close Menu
    What's Hot

    TakeOver Successfully Hosts Second Annual BitGala Celebrating Bitcoin In Las Vegas

    Metaplanet Continues $5.4B Bitcoin Buying Plan as Holdings Pass 8,000 BTC

    Bitcoin market of 2025 driven by stablecoin regulation: Finance Redefined

    Facebook X (Twitter) Instagram
    MarketsNews.co.uk
    • Live Chart
    • Brokers
    • Scam Broker
    • Reviews
    • Tools
      • Lot Size Calculator
      • Margin Calculator
      • PIPS Calculator
      • Profit & loss calculator
    Facebook X (Twitter) Instagram
    Start Trading
    Trending Topics:
    • Markets
    • Stocks
    • Cryptocurrency
    • Forex
    • Scam Broker
    MarketsNews.co.uk
    • Markets
    • Stocks
    • Cryptocurrency
    • Forex
    • Scam Broker
    Cryptocurrency

    Why $99,800 Is An Important Resistance To Break

    Anthony M. OrbisonBy Anthony M. OrbisonDecember 21, 2024No Comments3 Mins Read
    Share Facebook Twitter Pinterest Copy Link Telegram LinkedIn Tumblr Email
    Share
    Facebook Twitter LinkedIn Pinterest Email

    Este artículo también está disponible en español.

    The Bitcoin price is approaching the $100,000 level again after experiencing significant declines these past weeks. A crypto analyst has pointed out that the critical resistance level at $99,800 is crucial for Bitcoin’s next move. If the pioneer cryptocurrency can break through this level, it could trigger a significant breakout, potentially propelling Bitcoin past the $100,000 mark. 

    Related Reading

    Bitcoin Price Faces Resistance At $99,800

    Prominent crypto analyst Ali Martinez has shared a chart showing an In/Out of the Money Around Price (IOMAP) analysis of the distribution of Bitcoin wallets based on their purchase price. According to the analyst, the Bitcoin price is facing extreme resistance between the $97,500 and $99,800 price levels as it tries to breach $100,000 again.

    Martinez noted that around this price range, approximately 923,890 wallet addresses had purchased over 1.19 million BTC. This price zone acts as an important resistance level because many Bitcoin holders may look to sell and break even, potentially exerting selling pressure.

    In the IOMAP chart shared by Martinez, the green dots that signal ‘In the Money’ represent price levels below the current Bitcoin price, where wallet holders are in profit because they bought BTC at a lower value. On the other hand, the red dots that represent ‘Out of the Money’ show price levels of Bitcoin’s present value, where wallet holders are at a loss because they bought BTC at a higher price. 

    BTCUSD trading at $97,429 on the daily chart: TradingView.com

    Lastly, the white dot indicates ‘At the Money’ and represents the current price of Bitcoin at an average of $98,676, where some crypto wallets see neither profit nor loss. 

    Below Bitcoin’s current price, the chart shows strong buying zones, which could provide strong support if the pioneer cryptocurrency experiences a potential pullback. Martinez has forecasted that breaking through the critical resistance range between $97,500 and $99,800 would signal the start of a bullish rally for Bitcoin, potentially leading it to a new all-time high. 

    Currently, the Bitcoin price is trading at $98,652, steadily rising to return to previous highs above $100,000. To a new all-time high, Bitcoin will have to surge by over 7%, surpassing its present ATH above $104,000. 

    Related Reading

    Bitcoin’s Biggest Gains To Come After Christmas

    A popular crypto analyst identified as the ‘Crypto Rover’ has expressed optimism about Bitcoin’s near-term price potential this Q4. According to the analyst, Bitcoin has historically experienced its most significant gains right after Christmas during the halving years. 
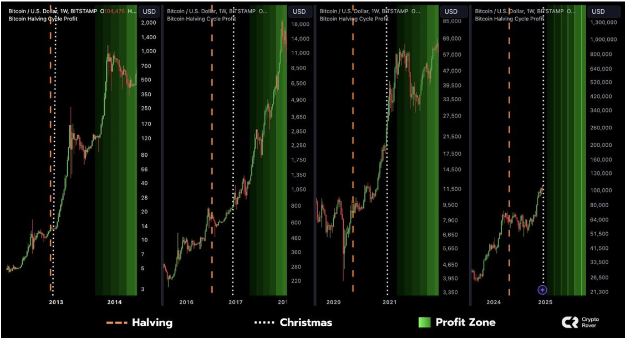
    The analyst shared a price chart showing Bitcoin’s market performance during each halving cycle. In the 2012 halving year, Bitcoin started a significant price rally, which extended into the following year. The same bullish trend occurred in the next halving years in 2016 and 2020, with Bitcoin hitting exponential price highs. 

    Based on this historical trend, Crypto Rover projects that Bitcoin could witness a similar bullish surge before the end of 2024, with the rally potentially continuing into 2025.  

    Featured image from Bloomberg Images, chart from TradingView

    Source link

    Share. Facebook Twitter Pinterest LinkedIn Tumblr Email Copy Link
    Previous ArticleDown 15%, Is Nvidia Stock a Buy Now?
    Next Article US agency warns extended government shutdown could lead to long lines at airports By Reuters
    Anthony M. Orbison
    • Website

    Related Posts

    TakeOver Successfully Hosts Second Annual BitGala Celebrating Bitcoin In Las Vegas

    June 6, 2025

    Metaplanet Continues $5.4B Bitcoin Buying Plan as Holdings Pass 8,000 BTC

    June 6, 2025

    Bitcoin market of 2025 driven by stablecoin regulation: Finance Redefined

    June 6, 2025
    Leave A Reply Cancel Reply

    Amazon.com, Inc.
    $213.57
    $5.66
    2.72%
    Meta Platforms, Inc.
    $697.71
    $13.09
    1.91%
    S&P 500
    $6,000.36
    $61.06
    1.03%
    Alphabet Inc.
    $174.92
    $5.11
    3.01%
    EUR/USD
    $1.14
    $0.0056
    0.49%
    EUR/JPY
    $165.05
    $0.774
    0.47%
    USD/CAD
    $1.37
    $0.0017
    0.12%

    Risk Disclosure: Trading in financial instruments and/or cryptocurrencies involves high risks including the risk of losing some, or all, of your investment amount, and may not be suitable for all investors. Prices of cryptocurrencies are extremely volatile and may be affected by external factors such as financial, regulatory or political events. Trading on margin increases the financial risks.
    Before deciding to trade in financial instrument or cryptocurrencies you should be fully informed of the risks and costs associated with trading the financial markets, carefully consider your investment objectives, level of experience, and risk appetite, and seek professional advice where needed.
    Fusion Media would like to remind you that the data contained in this website is not necessarily real-time nor accurate. The data and prices on the website are not necessarily provided by any market or exchange, but may be provided by market makers, and so prices may not be accurate and may differ from the actual price at any given market, meaning prices are indicative and not appropriate for trading purposes. Fusion Media and any provider of the data contained in this website will not accept liability for any loss or damage as a result of your trading, or your reliance on the information contained within this website.
    It is prohibited to use, store, reproduce, display, modify, transmit or distribute the data contained in this website without the explicit prior written permission of Fusion Media and/or the data provider. All intellectual property rights are reserved by the providers and/or the exchange providing the data contained in this website.
    Fusion Media may be compensated by the advertisers that appear on the website, based on your interaction with the advertisements or advertisers.
    We're social. Connect with us:

    Facebook X (Twitter)
    • Home
    • About us
    • Contact
    • Disclaimer
    • Privacy Policy
    © 2025 Marketsnews.co.uk

    Type above and press Enter to search. Press Esc to cancel.