Close Menu
    What's Hot

    Trump Memecoin Faces $520M Unlock in July as Price Drops 85%

    Analyst Michaël van de Poppe Says Bitcoin Is About To Go Higher, Updates Outlook on Sui and One Low-Cap Altcoin

    Solana indicators point north, bulls test $165 target

    Facebook X (Twitter) Instagram
    MarketsNews.co.uk
    • Live Chart
    • Brokers
    • Scam Broker
    • Reviews
    • Tools
      • Lot Size Calculator
      • Margin Calculator
      • PIPS Calculator
      • Profit & loss calculator
    Facebook X (Twitter) Instagram
    Start Trading
    Trending Topics:
    • Markets
    • Stocks
    • Cryptocurrency
    • Forex
    • Scam Broker
    MarketsNews.co.uk
    • Markets
    • Stocks
    • Cryptocurrency
    • Forex
    • Scam Broker
    Cryptocurrency

    XRP Price Risks Plummeting Below $2 As Sellers Take Control

    Anthony M. OrbisonBy Anthony M. OrbisonJune 7, 2025No Comments3 Mins Read
    Share Facebook Twitter Pinterest Copy Link Telegram LinkedIn Tumblr Email
    Share
    Facebook Twitter LinkedIn Pinterest Email

    Reason to trust

    Strict editorial policy that focuses on accuracy, relevance, and impartiality

    Created by industry experts and meticulously reviewed

    The highest standards in reporting and publishing

    Strict editorial policy that focuses on accuracy, relevance, and impartiality

    Morbi pretium leo et nisl aliquam mollis. Quisque arcu lorem, ultricies quis pellentesque nec, ullamcorper eu odio.

    XRP is currently showing signs of vulnerability as its recent price action is becoming increasingly bearish. After attempting to reclaim upside momentum above $ 2.60 in May, the cryptocurrency has struggled to maintain this run, and its price action over the past few days has brought it close to losing the $2.10 price level.

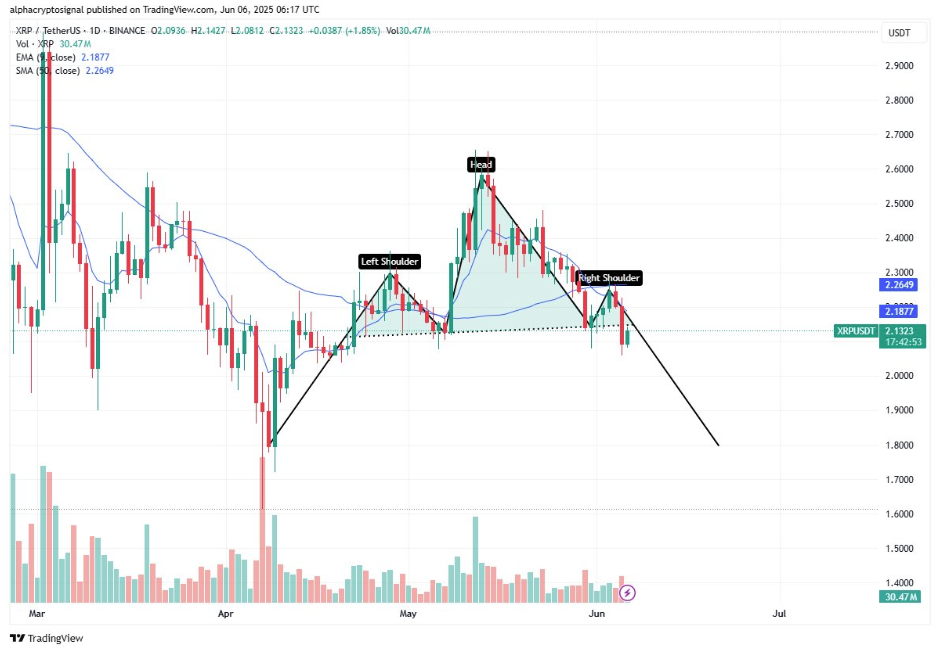
    Notably, the price action has resulted in the formation of a head and shoulders pattern on the daily candlestick chart. This might be the final straw that finally sends the XRP price plummeting below $2.

    Related Reading

    XRP Breaks Head And Shoulders Neckline

    As identified by a crypto analyst on the social media platform X, XRP has now printed a classic head and shoulders formation, with clearly defined symmetry between the left shoulder, head, and right shoulder. The head and shoulders formation began taking shape in late April, when the price climbed to $2.26 to become the left shoulder of the pattern. In early to mid-May, XRP surged above $2.60 to create the head of the formation and what appeared at the time to be a resumption of strong bullish momentum. 

    The rally lost steam soon after reaching that May peak, and the price began to retreat once again. By June 3, XRP made another attempt to push higher, reaching $2.27 in what is the formation of the right shoulder. However, this push wasn’t enough, and the ensuing price action has seen sellers gradually fighting for control.

    XRP is currently trading at $2.17. Chart: TradingView

    The head and shoulders pattern, which is often associated with trend reversals, became more concerning once XRP broke below the neckline around the $2.18 level to reach as low as $2.07 on July 6. Interestingly, the breakdown below the neckline was accompanied by increased volume, which provided additional confirmation of the bearish signal.
    EMA Rejections For XRP: What’s Next?

    Now that XRP has broken beneath the neckline, the $2.18 to $2.20 zone is beginning to flip into a firm resistance barrier for any attempt at recovery. The daily candlestick chart shows XRP continuing to trade below both the 9-day EMA and the 50-day SMA, which currently stand at $2.1877 and $2.2649 respectively.

    Despite a modest recovery over the past 24 hours, XRP has repeatedly failed to break back above the 9-day EMA since the neckline breakdown, showing persistent weakness in the short-term structure. 

    As long as XRP is trapped beneath the neckline and the EMA/SMA resistance cluster, the prevailing structure continues to favor a downward extension. Based on the head and shoulders setup, a measured move from the neckline breakdown projects a decline toward the $1.85 to $1.80 range. 

    Related Reading

    At the time of writing, XRP now finds itself trading at the neckline resistance again at $2.18 after a 2.6% increase in the past 24 hours from $2.13. However, the strength of this bounce is questionable, as it has occurred alongside a sharp 48.14% drop in trading volume. The next 24 hours will be important, as price behavior around the $2.18 to $2.20 range could determine whether XRP resumes its descent and break below $2.

    Featured image from Unsplash, chart from TradingView

    Source link

    Share. Facebook Twitter Pinterest LinkedIn Tumblr Email Copy Link
    Previous ArticleAlex Protocol to Reimburse Users After $8.3M Exploit on Bitcoin DeFi Platform
    Next Article Watch Out For These Levels If Bitcoin Price Returns To $100K: Blockchain Firm
    Anthony M. Orbison
    • Website

    Related Posts

    Trump Memecoin Faces $520M Unlock in July as Price Drops 85%

    June 8, 2025

    Analyst Michaël van de Poppe Says Bitcoin Is About To Go Higher, Updates Outlook on Sui and One Low-Cap Altcoin

    June 8, 2025

    Solana indicators point north, bulls test $165 target

    June 7, 2025
    Leave A Reply Cancel Reply

    Amazon.com, Inc.
    $213.57
    $5.66
    2.72%
    Meta Platforms, Inc.
    $697.71
    $13.09
    1.91%
    S&P 500
    $6,000.36
    $61.06
    1.03%
    Alphabet Inc.
    $174.92
    $5.11
    3.01%
    EUR/USD
    $1.14
    $0.0056
    0.49%
    EUR/JPY
    $165.05
    $0.774
    0.47%
    USD/CAD
    $1.37
    $0.0019
    0.14%

    Risk Disclosure: Trading in financial instruments and/or cryptocurrencies involves high risks including the risk of losing some, or all, of your investment amount, and may not be suitable for all investors. Prices of cryptocurrencies are extremely volatile and may be affected by external factors such as financial, regulatory or political events. Trading on margin increases the financial risks.
    Before deciding to trade in financial instrument or cryptocurrencies you should be fully informed of the risks and costs associated with trading the financial markets, carefully consider your investment objectives, level of experience, and risk appetite, and seek professional advice where needed.
    Fusion Media would like to remind you that the data contained in this website is not necessarily real-time nor accurate. The data and prices on the website are not necessarily provided by any market or exchange, but may be provided by market makers, and so prices may not be accurate and may differ from the actual price at any given market, meaning prices are indicative and not appropriate for trading purposes. Fusion Media and any provider of the data contained in this website will not accept liability for any loss or damage as a result of your trading, or your reliance on the information contained within this website.
    It is prohibited to use, store, reproduce, display, modify, transmit or distribute the data contained in this website without the explicit prior written permission of Fusion Media and/or the data provider. All intellectual property rights are reserved by the providers and/or the exchange providing the data contained in this website.
    Fusion Media may be compensated by the advertisers that appear on the website, based on your interaction with the advertisements or advertisers.
    We're social. Connect with us:

    Facebook X (Twitter)
    • Home
    • About us
    • Contact
    • Disclaimer
    • Privacy Policy
    © 2025 Marketsnews.co.uk

    Type above and press Enter to search. Press Esc to cancel.