Close Menu
    What's Hot

    Is Bitcoin price rally to $150K possible by year’s end?

    ETF issuers’ latest warning – SEC’s approval process ‘kills innovation, aids giants’

    NFT artist relives ‘crypto tax nightmare’ in new song

    Facebook X (Twitter) Instagram
    MarketsNews.co.uk
    • Live Chart
    • Brokers
    • Scam Broker
    • Reviews
    • Tools
      • Lot Size Calculator
      • Margin Calculator
      • PIPS Calculator
      • Profit & loss calculator
    Facebook X (Twitter) Instagram
    Start Trading
    Trending Topics:
    • Markets
    • Stocks
    • Cryptocurrency
    • Forex
    • Scam Broker
    MarketsNews.co.uk
    • Markets
    • Stocks
    • Cryptocurrency
    • Forex
    • Scam Broker
    Cryptocurrency

    Will Bonk Coin surpass July’s high in October? Technical indicators suggest…

    Anthony M. OrbisonBy Anthony M. OrbisonOctober 2, 2024No Comments2 Mins Read
    Share Facebook Twitter Pinterest Copy Link Telegram LinkedIn Tumblr Email
    Will Bonk Coin surpass Julys high in October Technical indicators.webp
    Will Bonk Coin surpass Julys high in October Technical indicators.webp
    Share
    Facebook Twitter LinkedIn Pinterest Email
    • BONK has a strongly bullish short-term outlook.
    • The potential for a bearish divergence could see volatility and a price dip in the coming days.

    Bonk [BONK] was one of the popular meme coins that held up well while the majority of the market experienced increased sell pressure. BONK also saw a large short-term dip, but the bulls were quick to buy it.

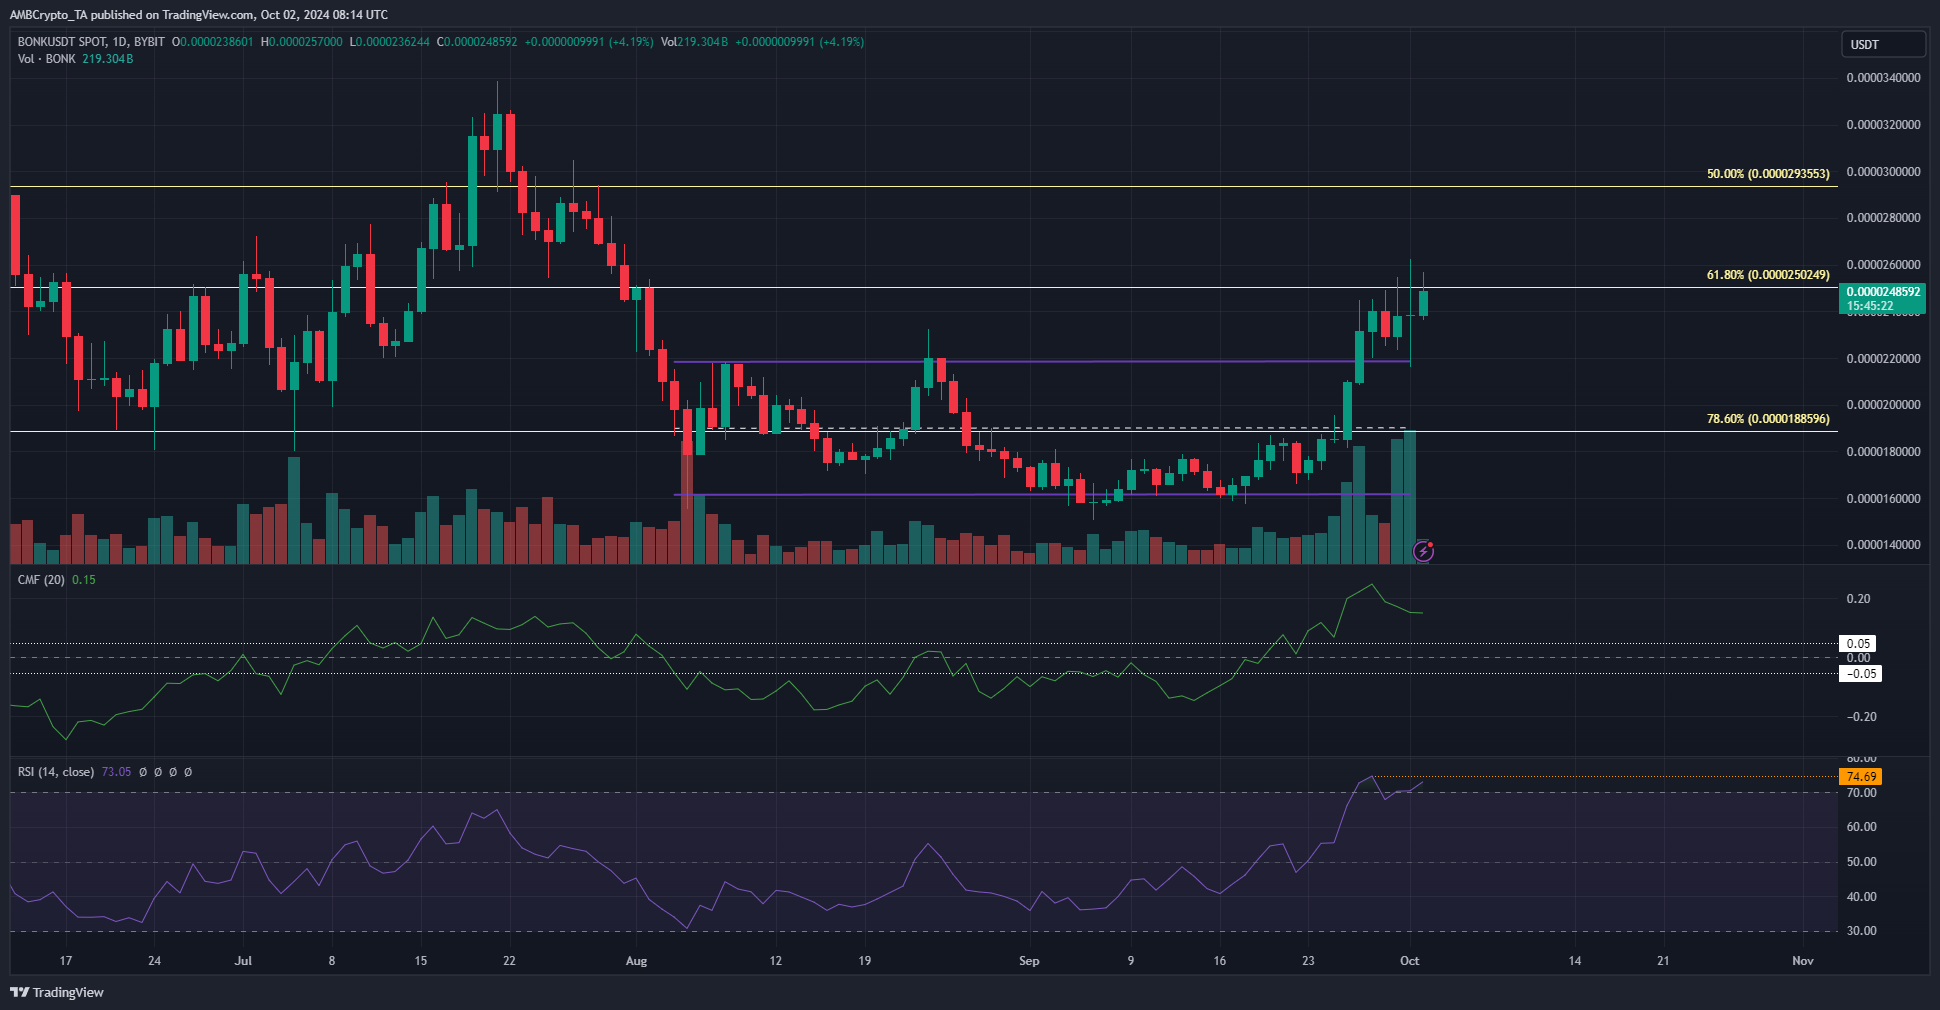
    This influx of buying saw Bonk coin regain 10.8% after the dip. A resistance level that has not been breached since July stood in the way of the bulls- will they clear this level soon?

    Range breakout and retest boosts bullish hopes

    BONK 1-Day TradingView

    Source: BONK/USDT on TradingView

    Bonk coin showed remarkable strength despite the market-wide price drop in the past three days. This panic selling saw BONK retest the former range highs and continue its uptrend.

    At press time the token was trading at $0.0000248, just beneath the $0.000025 resistance level.

    Despite the strong bullishness of Bonk coin in recent weeks, it should be remembered that the higher timeframe trend is downward. This is exemplified by the Fibonacci retracement level resistances at $0.000025 and $0.0000293.

    The RSI was at 73, but it risked forming a bearish divergence if it fails to climb past 74.69 in the coming days. If this happens it could be an early signal of a local top and an impending retracement.

    Liquidation heatmap shows upside target
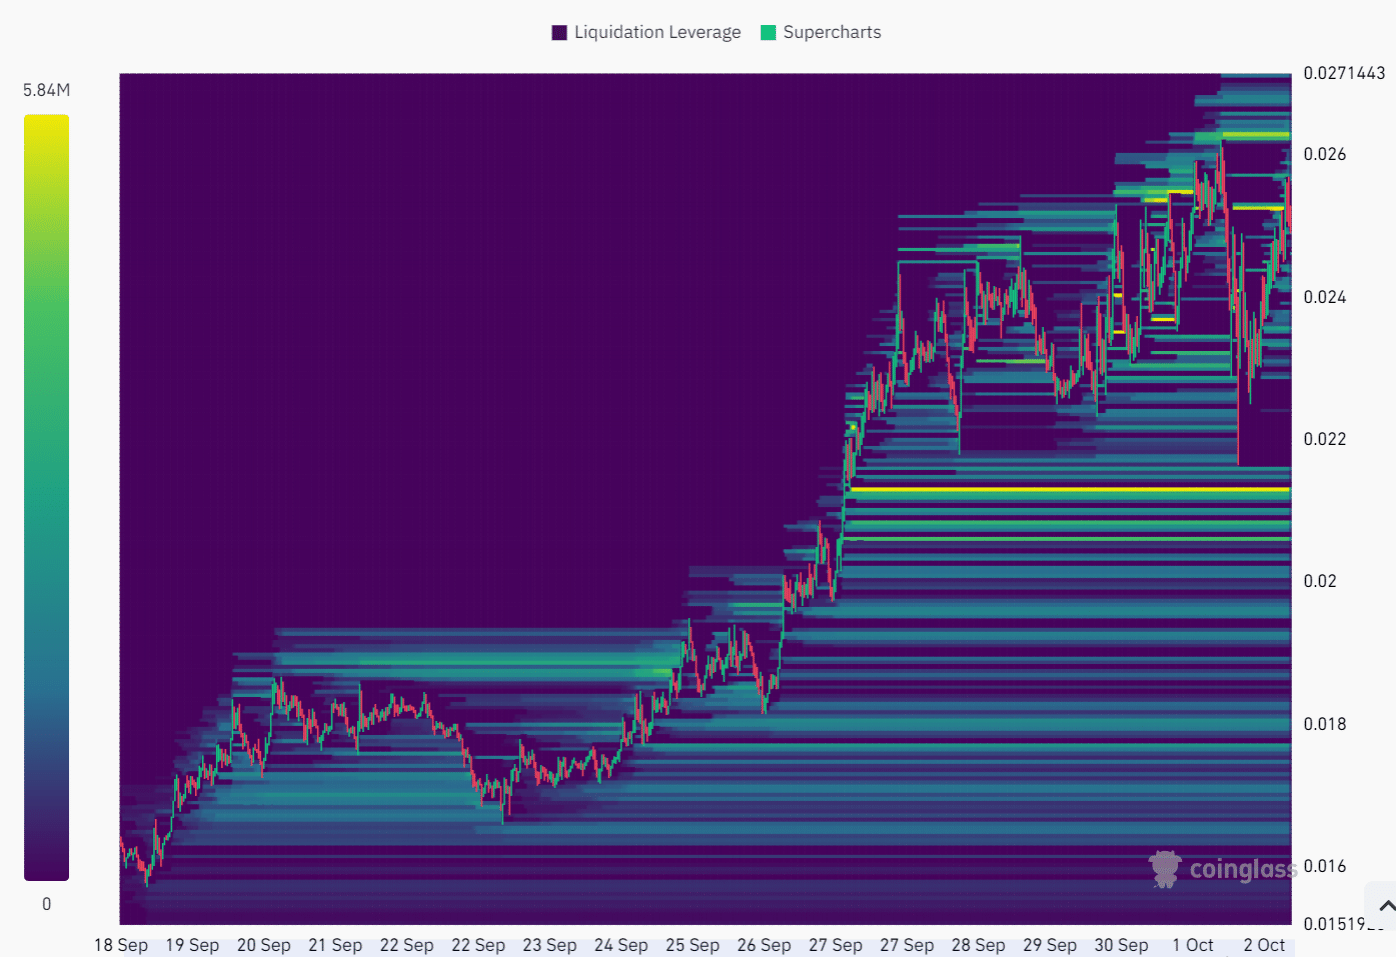
    BONK Liquidation HeatmapBONK Liquidation Heatmap

    Source: Coinglass

    The liquidation heatmap of the past two weeks showed that the $0.0000263 zone is the next short-term target for Bonk coin. The technical indicators were strongly bullish and the recent volatility that rocked the market did not affect BONK too badly.


    Realistic or not, here’s BONK’s market cap in BTC’s terms


    While unlikely, in the case of rejection at $0.0000252 and a short-term downtrend, the $0.0000211 is the next magnetic zone of interest to the south.

    AMBCrypto’s analysis showed that a move toward and past the $0.0000263 is the expectation for this week.

    Disclaimer: The information presented does not constitute financial, investment, trading, or other types of advice and is solely the writer’s opinion

    Next: Can Polkadot’s recovery propel it to new heights?

    Source link

    Share. Facebook Twitter Pinterest LinkedIn Tumblr Email Copy Link
    Previous ArticleLabour donor anticipates honour after backing party’s election campaign, wife claims
    Next Article Tesla did something it hadn’t done all year
    Anthony M. Orbison
    • Website

    Related Posts

    Is Bitcoin price rally to $150K possible by year’s end?

    June 7, 2025

    ETF issuers’ latest warning – SEC’s approval process ‘kills innovation, aids giants’

    June 7, 2025

    NFT artist relives ‘crypto tax nightmare’ in new song

    June 7, 2025
    Leave A Reply Cancel Reply

    Amazon.com, Inc.
    $213.57
    $5.66
    2.72%
    Meta Platforms, Inc.
    $697.71
    $13.09
    1.91%
    S&P 500
    $6,000.36
    $61.06
    1.03%
    Alphabet Inc.
    $174.92
    $5.11
    3.01%
    EUR/USD
    $1.14
    $0.0056
    0.49%
    EUR/JPY
    $165.05
    $0.774
    0.47%
    USD/CAD
    $1.37
    $0.0019
    0.14%

    Risk Disclosure: Trading in financial instruments and/or cryptocurrencies involves high risks including the risk of losing some, or all, of your investment amount, and may not be suitable for all investors. Prices of cryptocurrencies are extremely volatile and may be affected by external factors such as financial, regulatory or political events. Trading on margin increases the financial risks.
    Before deciding to trade in financial instrument or cryptocurrencies you should be fully informed of the risks and costs associated with trading the financial markets, carefully consider your investment objectives, level of experience, and risk appetite, and seek professional advice where needed.
    Fusion Media would like to remind you that the data contained in this website is not necessarily real-time nor accurate. The data and prices on the website are not necessarily provided by any market or exchange, but may be provided by market makers, and so prices may not be accurate and may differ from the actual price at any given market, meaning prices are indicative and not appropriate for trading purposes. Fusion Media and any provider of the data contained in this website will not accept liability for any loss or damage as a result of your trading, or your reliance on the information contained within this website.
    It is prohibited to use, store, reproduce, display, modify, transmit or distribute the data contained in this website without the explicit prior written permission of Fusion Media and/or the data provider. All intellectual property rights are reserved by the providers and/or the exchange providing the data contained in this website.
    Fusion Media may be compensated by the advertisers that appear on the website, based on your interaction with the advertisements or advertisers.
    We're social. Connect with us:

    Facebook X (Twitter)
    • Home
    • About us
    • Contact
    • Disclaimer
    • Privacy Policy
    © 2025 Marketsnews.co.uk

    Type above and press Enter to search. Press Esc to cancel.