Close Menu
    What's Hot

    US Missed Out On $21B From Its BTC Sales Since 2014

    Bitcoin price dips under $104K as Russia-Ukraine woes rile US stocks

    NBX Acquires Bitcoin, Becomes First Public Bitcoin Treasury Company In Norway

    Facebook X (Twitter) Instagram
    MarketsNews.co.uk
    • Live Chart
    • Brokers
    • Scam Broker
    • Reviews
    • Tools
      • Lot Size Calculator
      • Margin Calculator
      • PIPS Calculator
      • Profit & loss calculator
    Facebook X (Twitter) Instagram
    Start Trading
    Trending Topics:
    • Markets
    • Stocks
    • Cryptocurrency
    • Forex
    • Scam Broker
    MarketsNews.co.uk
    • Markets
    • Stocks
    • Cryptocurrency
    • Forex
    • Scam Broker
    Cryptocurrency

    ADA faces strong bearish sentiment as prices decline

    Anthony M. OrbisonBy Anthony M. OrbisonDecember 23, 2024No Comments3 Mins Read
    Share Facebook Twitter Pinterest Copy Link Telegram LinkedIn Tumblr Email
    Share
    Facebook Twitter LinkedIn Pinterest Email
    • ADA has declined by 8.77% over the past 24 hours.
    • Market fundamentals show strong bearish outlook while an analyst predict a rally after correction.

    Since hitting $1.3, Cardano [ADA] has struggled to maintain an upward momentum. As such, it has experienced a strong downward pressure which has strengthened over the past week. Over this period, ADA has dropped to hit a low of $0.77.

    In fact, at the time of writing, Cardano was trading at $0.9013. This marked an 8.77% decline over the past day. Equally, it has declined by 14.45% on weekly charts.

    The recent decline has left Cardano community talking with some analysts showing optimism. Popular crypto analyst Ali Martinez has suggested a potential rally to $6 citing previous cycles.

    Market sentiment

    In his analysis, Martinez posited that Cardano is following a similar pattern to its previous cycles.
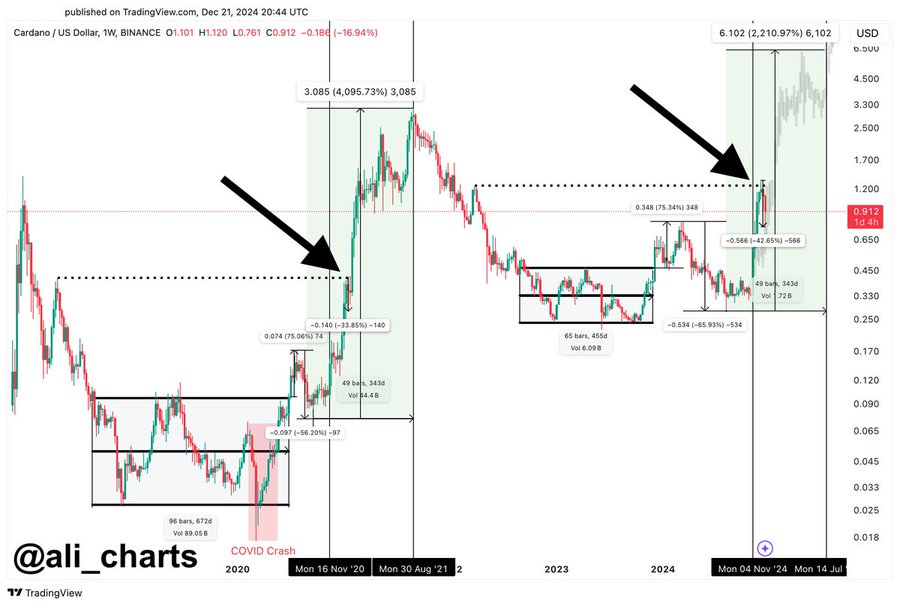
    Source: X

    According to him, back in 2020, the first major correction after a bull rally started at the same time it happened today. Thus, after this correction, the market will strengthen enough for another rally.

    In context, during the 2020 rally, ADA surged from $0.088 to $0.190. After this uptrend, the altcoin retraced to a low of $0.12. However, after the market correction, Cardano rallied from a low of $0.12 on 20th December, 2020, to $1.02 through February 2024. This marked a whopping 750% rally.

    Therefore, if history is anything to go by,  Cardano could see a massive rally after the current correction.

    What ADA charts indicate

    While the historical cycle provided by Martinez offers a promising outlook, other market indicators tell a different story. This is especially because Cardano’s on-chain activities have dropped to recent lows.
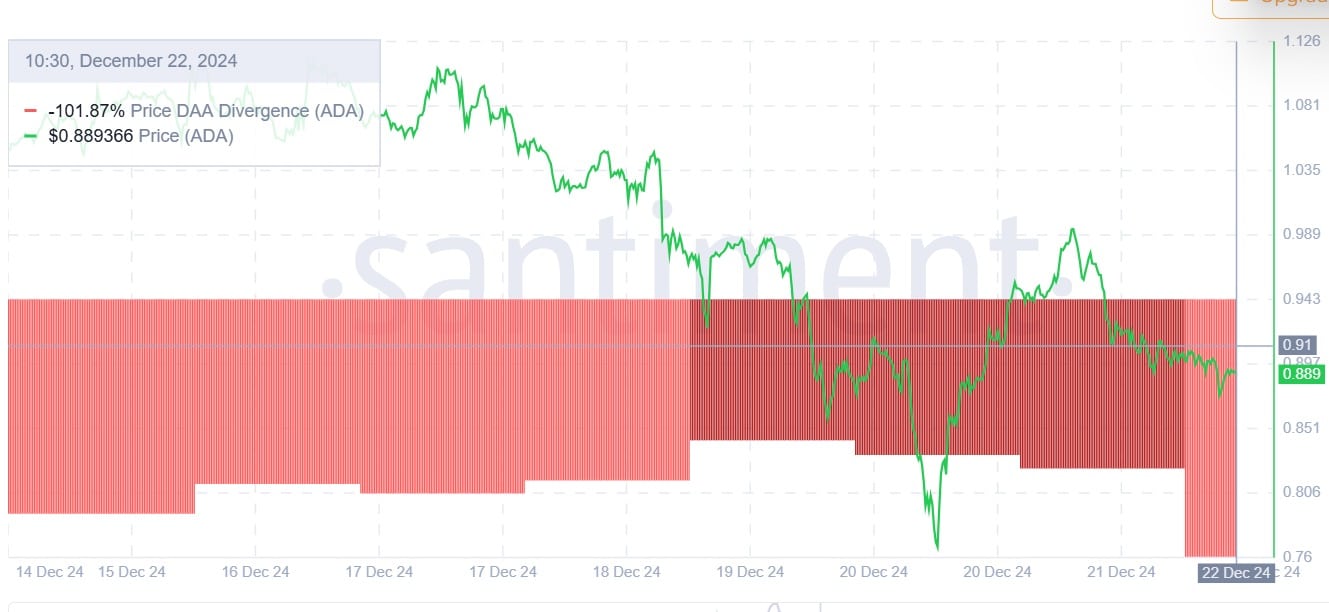
    Source: Santiment

    For starters, Cardano’s Price DAA divergence has remained negative over the past week. When this remains negative for a long period, it implies that the current ADA price and market valuation are not supported by growth in on-chain activities.

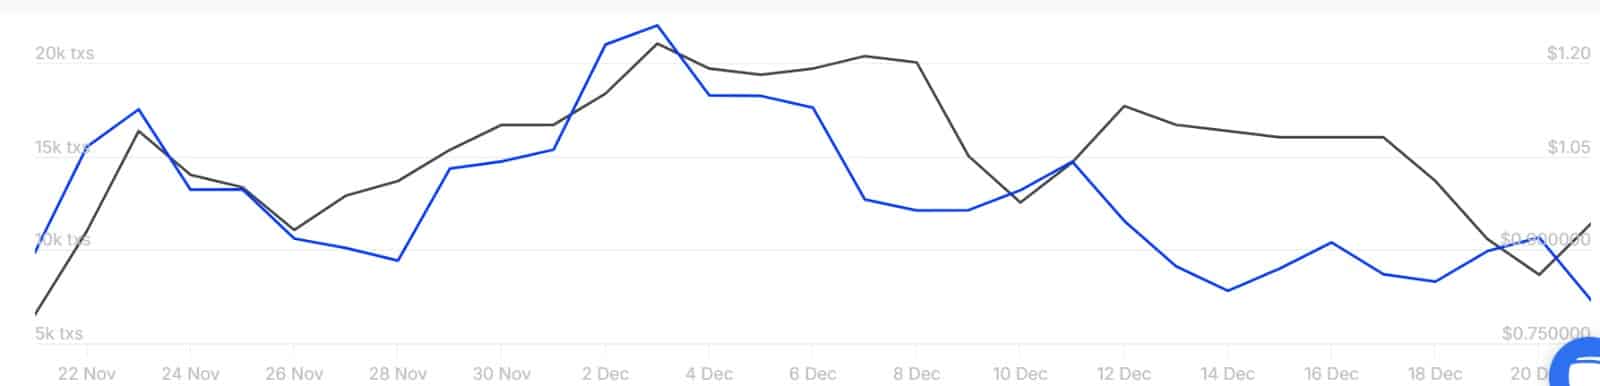
    Source: IntoTheBlock

    We can see this phenomenon, especially among large holders. As such, large transactions have dropped to hit a monthly low.
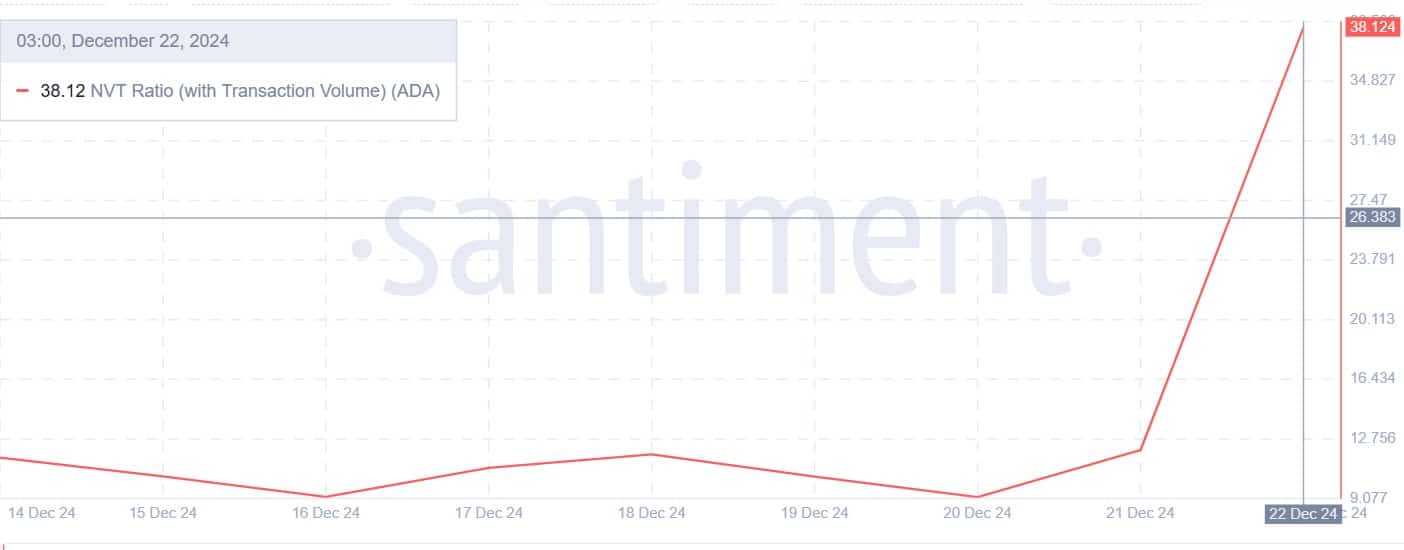
    Source: Santiment

    Additionally, Cardano’s NVT ratio with transaction volume has spiked from 9.17 to 38.12 at press time.

    This implies that despite the recent drop, ADA’s market value is still growing faster than its on-chain transaction. Such a trend suggests that speculation is driving price growth rather than increased usage and price is still inflated.

    Therefore, for sustained price growth, Cardano needs to see a relative increase in active addresses, transactions, and overall on-chain activities.


    Read Cardano’s [ADA] Price Prediction 2024-25


    As such, with the prevailing conditions, it seems ADA’s corrective phase is not over. As such, before a trend reversal, ADA could drop to $0.85 in the short term.

    Subsequently, a trend reversal will see Cardano reclaim the $1.0 resistance. The $6 is currently far-fetched as the altcoin has to break out from $1.2, $1.6, $1.8, and $2.4 resistance levels.

    Next: Bitcoin ETFs consume more BTC than miners produce: What this shift means

    Source link

    Share. Facebook Twitter Pinterest LinkedIn Tumblr Email Copy Link
    Previous ArticleDeloitte targets slashing UK travel and expenses spending by half
    Next Article Australia stocks higher at close of trade; S&P/ASX 200 up 1.67% By Investing.com
    Anthony M. Orbison
    • Website

    Related Posts

    US Missed Out On $21B From Its BTC Sales Since 2014

    June 2, 2025

    Bitcoin price dips under $104K as Russia-Ukraine woes rile US stocks

    June 2, 2025

    NBX Acquires Bitcoin, Becomes First Public Bitcoin Treasury Company In Norway

    June 2, 2025
    Leave A Reply Cancel Reply

    Amazon.com, Inc.
    $206.65
    $1.64
    0.80%
    Meta Platforms, Inc.
    $670.90
    $23.41
    3.62%
    S&P 500
    $5,935.94
    $24.25
    0.41%
    Alphabet Inc.
    $170.37
    $2.48
    1.43%
    EUR/USD
    $1.14
    $0.0097
    0.86%
    EUR/JPY
    $163.17
    $0.306
    0.19%
    USD/CAD
    $1.37
    $0.0026
    0.19%

    Risk Disclosure: Trading in financial instruments and/or cryptocurrencies involves high risks including the risk of losing some, or all, of your investment amount, and may not be suitable for all investors. Prices of cryptocurrencies are extremely volatile and may be affected by external factors such as financial, regulatory or political events. Trading on margin increases the financial risks.
    Before deciding to trade in financial instrument or cryptocurrencies you should be fully informed of the risks and costs associated with trading the financial markets, carefully consider your investment objectives, level of experience, and risk appetite, and seek professional advice where needed.
    Fusion Media would like to remind you that the data contained in this website is not necessarily real-time nor accurate. The data and prices on the website are not necessarily provided by any market or exchange, but may be provided by market makers, and so prices may not be accurate and may differ from the actual price at any given market, meaning prices are indicative and not appropriate for trading purposes. Fusion Media and any provider of the data contained in this website will not accept liability for any loss or damage as a result of your trading, or your reliance on the information contained within this website.
    It is prohibited to use, store, reproduce, display, modify, transmit or distribute the data contained in this website without the explicit prior written permission of Fusion Media and/or the data provider. All intellectual property rights are reserved by the providers and/or the exchange providing the data contained in this website.
    Fusion Media may be compensated by the advertisers that appear on the website, based on your interaction with the advertisements or advertisers.
    We're social. Connect with us:

    Facebook X (Twitter)
    • Home
    • About us
    • Contact
    • Disclaimer
    • Privacy Policy
    © 2025 Marketsnews.co.uk

    Type above and press Enter to search. Press Esc to cancel.