Close Menu
    What's Hot

    Strategy Buys $110 Million Worth Of Bitcoin

    Strategy Acquires $110.2M of Bitcoin in Latest Buy

    The Blockchain Group Accelerates Bitcoin Treasury Strategy With €300M Raise

    Facebook X (Twitter) Instagram
    MarketsNews.co.uk
    • Live Chart
    • Brokers
    • Scam Broker
    • Reviews
    • Tools
      • Lot Size Calculator
      • Margin Calculator
      • PIPS Calculator
      • Profit & loss calculator
    Facebook X (Twitter) Instagram
    Start Trading
    Trending Topics:
    • Markets
    • Stocks
    • Cryptocurrency
    • Forex
    • Scam Broker
    MarketsNews.co.uk
    • Markets
    • Stocks
    • Cryptocurrency
    • Forex
    • Scam Broker
    Cryptocurrency

    Analyst’s ABC Correction Forecast Plays Out Perfectly, Second Half Predicts Bullish Impulse To $2.8

    Anthony M. OrbisonBy Anthony M. OrbisonDecember 10, 2024No Comments3 Mins Read
    Share Facebook Twitter Pinterest Copy Link Telegram LinkedIn Tumblr Email
    Share
    Facebook Twitter LinkedIn Pinterest Email

    Este artículo también está disponible en español.

    The XRP price action has played out notable volatility in the past eight or so weeks, with intense trading activity not seen in over six years. Following the U.S. presidential election on November 5, 2024, where Donald Trump secured victory, XRP’s value surged over 400%, reaching a peak of $2.90 on crypto exchange Binance on December 3. 

    However, the XRP price has experienced a downturn in the past week. Interestingly, this XRP price correction seems to be playing out an ABC correction path, with technical analysis suggesting a more downturn before the next leg up.

    XRP Price Exhibiting ABC Correction

    The XRP price correction since reaching the $2.9 mark has been highlighted by an ABC pattern that is almost nearing its end. Particularly, this pattern constitutes two downtrend waves A and C and a minor uptrend wave B in between.

    Related Reading

    According to the price chart below, which is of the XRP/US Dollar pair on the 4-hour candlestick timeframe, the first downtred wave A kicked off after the XRP price was rejected at resistance around $2.9 on December 3 up until it bottomed out around $2.16 on December 5, representing a 25% decline in two days. From there, it went on a minor uptrend wave B, which indicated that the bulls were still in action. Wave B culminated with a lower high at $2.65 on December 9, which translates to another 22% increase in four days. 

    Since reaching this lower high, the XRP price has kicked off another correction path in the past 24 hours, giving rise to the notion of corrective wave C now in action. If a similar trend were to play out like that of wave A, we could see the XRP price correcting by another 25% from $2.65, which would put the bottom just below $2 before another bounce up. This is very logical, considering that the $2 price level serves as a psychological threshold that the bulls would be preventing a break below.

    Source: TradingView

    Bullish Impulse Suggests Next Move To $2.8 And Beyond

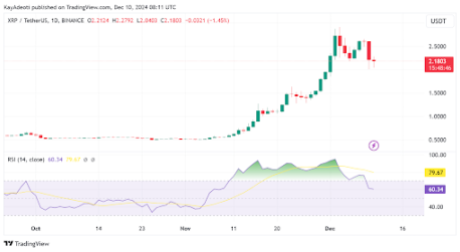
    At the time of writing, the XRP price is trading at $2.19 and is down by almost 10% in the past 24 hours. The ongoing wave C, which is the final leg of the ABC corrective pattern, could continue on a downtrend until it reaches resistance at $2. Technical indicators support this outlook, especially the Relative Strength Index (RSI).

    Related Reading

    The RSI has slipped below its overbought zone for the first time since November 10. This signals a cooling off of the bullish momentum that propelled XRP to its recent highs, paving the way for the corrective wave C to run its course.

    XRP Price ABC 2
    Source: TradingView

    Despite this pullback, market dynamics suggest that a bounce from the $2 level is a strong possibility. Such a rebound could mark the beginning of a renewed bullish wave and drive the XRP price toward $2.80 and beyond. This scenario aligns with the broader outlook for XRP, which is still rolling in investor optimism regarding regulatory clarity after a new US presidential administration comes into power in January 2025.

    XRP price chart from Tradingview.com
    Price struggles at $2.1 | Source: XRPUSDT on Tradingview.com

    Featured image created with Dall.E, chart from Tradingview.com

    Source link

    Share. Facebook Twitter Pinterest LinkedIn Tumblr Email Copy Link
    Previous ArticleAmazon SVP Colleen Aubrey builds AWS enterprise business
    Next Article Vestis shares up after report of buyout interest By Investing.com
    Anthony M. Orbison
    • Website

    Related Posts

    Strategy Buys $110 Million Worth Of Bitcoin

    June 9, 2025

    Strategy Acquires $110.2M of Bitcoin in Latest Buy

    June 9, 2025

    The Blockchain Group Accelerates Bitcoin Treasury Strategy With €300M Raise

    June 9, 2025
    Leave A Reply Cancel Reply

    Amazon.com, Inc.
    $214.63
    $1.06
    0.50%
    Meta Platforms, Inc.
    $701.05
    $3.34
    0.48%
    S&P 500
    $6,006.97
    $6.61
    0.11%
    Alphabet Inc.
    $176.73
    $2.01
    1.15%
    EUR/USD
    $1.14
    $0.0021
    0.18%
    EUR/JPY
    $164.97
    $0.084
    0.05%
    USD/CAD
    $1.37
    $0.0001
    0.00%

    Risk Disclosure: Trading in financial instruments and/or cryptocurrencies involves high risks including the risk of losing some, or all, of your investment amount, and may not be suitable for all investors. Prices of cryptocurrencies are extremely volatile and may be affected by external factors such as financial, regulatory or political events. Trading on margin increases the financial risks.
    Before deciding to trade in financial instrument or cryptocurrencies you should be fully informed of the risks and costs associated with trading the financial markets, carefully consider your investment objectives, level of experience, and risk appetite, and seek professional advice where needed.
    Fusion Media would like to remind you that the data contained in this website is not necessarily real-time nor accurate. The data and prices on the website are not necessarily provided by any market or exchange, but may be provided by market makers, and so prices may not be accurate and may differ from the actual price at any given market, meaning prices are indicative and not appropriate for trading purposes. Fusion Media and any provider of the data contained in this website will not accept liability for any loss or damage as a result of your trading, or your reliance on the information contained within this website.
    It is prohibited to use, store, reproduce, display, modify, transmit or distribute the data contained in this website without the explicit prior written permission of Fusion Media and/or the data provider. All intellectual property rights are reserved by the providers and/or the exchange providing the data contained in this website.
    Fusion Media may be compensated by the advertisers that appear on the website, based on your interaction with the advertisements or advertisers.
    We're social. Connect with us:

    Facebook X (Twitter)
    • Home
    • About us
    • Contact
    • Disclaimer
    • Privacy Policy
    © 2025 Marketsnews.co.uk

    Type above and press Enter to search. Press Esc to cancel.