Close Menu
    What's Hot

    Ethereum price slides lower, nearing the $2,400 mark

    Spot Ethereum ETFs post 14-day inflow run, lifting year-to-date haul above $3B

    Bitcoin At A Crossroads: $97,000 Cost Basis Holds Key To Next Breakout

    Facebook X (Twitter) Instagram
    MarketsNews.co.uk
    • Live Chart
    • Brokers
    • Scam Broker
    • Reviews
    • Tools
      • Lot Size Calculator
      • Margin Calculator
      • PIPS Calculator
      • Profit & loss calculator
    Facebook X (Twitter) Instagram
    Start Trading
    Trending Topics:
    • Markets
    • Stocks
    • Cryptocurrency
    • Forex
    • Scam Broker
    MarketsNews.co.uk
    • Markets
    • Stocks
    • Cryptocurrency
    • Forex
    • Scam Broker
    Cryptocurrency

    Bitcoin Stuck Between $99K And $102K – Analyst Explains Macro Situation

    Anthony M. OrbisonBy Anthony M. OrbisonDecember 13, 2024No Comments4 Mins Read
    Share Facebook Twitter Pinterest Copy Link Telegram LinkedIn Tumblr Email
    Share
    Facebook Twitter LinkedIn Pinterest Email

    Este artículo también está disponible en español.

    Bitcoin has remained range-bound between $99,000 and $102,000 since breaking above the psychological $100,000 level. While the breakout initially sparked excitement among investors, the current price action reflects market indecision, with no clear direction for the weeks ahead. Concerns about a potential correction linger as the broader market awaits stronger signals to confirm the next trend.

    Related Reading

    Top analyst Axel Adler recently shared insights on X, supported by data from CryptoQuant, highlighting two crucial support levels at $90,000 and $93,000. These levels represent key demand areas, underscoring that the market floor has moved higher—a positive sign of resilience even amid the uncertainty. According to Adler, these supports could act as safety nets, absorbing selling pressure if Bitcoin fails to sustain its momentum above $100,000.

    Despite the hesitation, Bitcoin’s ability to hold above $100,000 for consecutive days has provided some optimism among investors. It remains uncertain whether the market will break out of its current range to continue the bull run or face a correction. For now, all eyes are on Bitcoin’s price action near these critical levels as traders look for clues that could set the tone for the remainder of the year.

    Bitcoin Technical Details Explained

    Bitcoin has faced choppy price action recently, leaving the market in anticipation of the next big move, whether upward or downward. Traders and investors remain cautious, closely watching key technical and macroeconomic signals. The uncertainty has kept Bitcoin trading between $99,000 and $102,000 as market participants wait for a decisive breakout.

    Top analyst Axel Adler recently shared a detailed macro analysis on X, shedding light on Bitcoin’s current position. According to Adler, the market has established two crucial support levels at $90,000 and $93,000, signaling that the overall market floor has shifted higher.

    These levels could act as strong safety nets if Bitcoin experiences a short-term pullback. Adler emphasized that these supports reflect growing confidence in Bitcoin’s long-term potential despite the current indecision.

    Bitcoin Relative Volatility Deviation | Source: Axel Adler on X

    One notable observation is the decline in trading volume peaks, which presents a neutral signal. This indicates that traders avoid excessive risk, preferring to wait for clearer market signals before entering significant positions. The declining volume also suggests a reduced likelihood of extreme price volatility in the immediate term.

    Related Reading

    With Bitcoin stuck in its current range, the market remains highly sensitive to external factors. Any significant news or events could quickly trigger a breakout or breakdown, setting the stage for Bitcoin’s next major move.

    BTC Price Action 

    Bitcoin is trading at $100,100 after failing to break above its all-time high of $103,600. The current consolidation reflects market indecision while the price remains above key demand levels. Bitcoin’s resilience above $100,000 suggests bullish momentum may still be in play, as buyers look for opportunities to push the price higher.

    BTC testing liquidity at $100K
    BTC testing liquidity at $100K | Source: BTCUSDT chart on TradingView

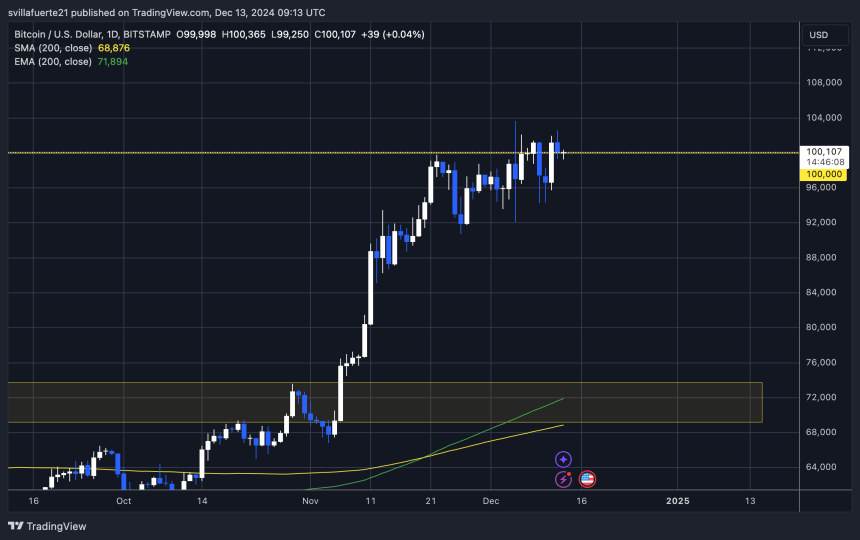
    However, the next few days will be critical. A correction could be imminent if Bitcoin fails to hold above the psychologically significant $100,000 level and struggles to find the momentum to surpass $103,600. Analysts warn that a break below $100,000 could trigger a wave of selling pressure, pushing the price toward lower support zones.

    The $93,000 level is a crucial area to watch during a downturn. Losing this key support would significantly heighten bearish risks, as it represents a critical demand zone for the market. A failure at this level could result in a sharper correction, potentially challenging Bitcoin’s bullish structure.

    Related Reading

    Bitcoin’s ability to hold above $100,000 provides a cautious sense of optimism. If bulls can maintain support and fuel a breakout above the all-time high, Bitcoin could enter a new price discovery phase. However, the high stakes make every move above or below these levels pivotal for short-term direction.

    Featured image from Dall-E, chart from TradingView

    Source link

    Share. Facebook Twitter Pinterest LinkedIn Tumblr Email Copy Link
    Previous ArticlePorsche holding company warns of writedown in Volkswagen stake of up to €20bn
    Next Article US stocks close flat as Nasdaq extends weekly gains, S&P 500 and Dow dip By Reuters
    Anthony M. Orbison
    • Website

    Related Posts

    Ethereum price slides lower, nearing the $2,400 mark

    June 8, 2025

    Spot Ethereum ETFs post 14-day inflow run, lifting year-to-date haul above $3B

    June 8, 2025

    Bitcoin At A Crossroads: $97,000 Cost Basis Holds Key To Next Breakout

    June 8, 2025
    Leave A Reply Cancel Reply

    Amazon.com, Inc.
    $213.57
    $5.66
    2.72%
    Meta Platforms, Inc.
    $697.71
    $13.09
    1.91%
    S&P 500
    $6,000.36
    $61.06
    1.03%
    Alphabet Inc.
    $174.92
    $5.11
    3.01%
    EUR/USD
    $1.14
    $0.0056
    0.49%
    EUR/JPY
    $165.05
    $0.774
    0.47%
    USD/CAD
    $1.37
    $0.0018
    0.13%

    Risk Disclosure: Trading in financial instruments and/or cryptocurrencies involves high risks including the risk of losing some, or all, of your investment amount, and may not be suitable for all investors. Prices of cryptocurrencies are extremely volatile and may be affected by external factors such as financial, regulatory or political events. Trading on margin increases the financial risks.
    Before deciding to trade in financial instrument or cryptocurrencies you should be fully informed of the risks and costs associated with trading the financial markets, carefully consider your investment objectives, level of experience, and risk appetite, and seek professional advice where needed.
    Fusion Media would like to remind you that the data contained in this website is not necessarily real-time nor accurate. The data and prices on the website are not necessarily provided by any market or exchange, but may be provided by market makers, and so prices may not be accurate and may differ from the actual price at any given market, meaning prices are indicative and not appropriate for trading purposes. Fusion Media and any provider of the data contained in this website will not accept liability for any loss or damage as a result of your trading, or your reliance on the information contained within this website.
    It is prohibited to use, store, reproduce, display, modify, transmit or distribute the data contained in this website without the explicit prior written permission of Fusion Media and/or the data provider. All intellectual property rights are reserved by the providers and/or the exchange providing the data contained in this website.
    Fusion Media may be compensated by the advertisers that appear on the website, based on your interaction with the advertisements or advertisers.
    We're social. Connect with us:

    Facebook X (Twitter)
    • Home
    • About us
    • Contact
    • Disclaimer
    • Privacy Policy
    © 2025 Marketsnews.co.uk

    Type above and press Enter to search. Press Esc to cancel.