Close Menu
    What's Hot

    Trader Predicts Rallies for Ethereum Amid Trump’s ‘Tariff Tantrum,’ Forecasts New All-Time High for ETH-Based Memecoin

    James Wynn takes $5.3m loss, bets $1.2b on Bitcoin lifeline

    Ethereum (ETH) Could Hit $3,000 Sooner Than Expected

    Facebook X (Twitter) Instagram
    MarketsNews.co.uk
    • Live Chart
    • Brokers
    • Scam Broker
    • Reviews
    • Tools
      • Lot Size Calculator
      • Margin Calculator
      • PIPS Calculator
      • Profit & loss calculator
    Facebook X (Twitter) Instagram
    Start Trading
    Trending Topics:
    • Markets
    • Stocks
    • Cryptocurrency
    • Forex
    • Scam Broker
    MarketsNews.co.uk
    • Markets
    • Stocks
    • Cryptocurrency
    • Forex
    • Scam Broker
    Cryptocurrency

    Breakdown Towards $106,000 Or New ATH?

    Anthony M. OrbisonBy Anthony M. OrbisonMay 25, 2025No Comments3 Mins Read
    Share Facebook Twitter Pinterest Copy Link Telegram LinkedIn Tumblr Email
    Share
    Facebook Twitter LinkedIn Pinterest Email

    Reason to trust

    Strict editorial policy that focuses on accuracy, relevance, and impartiality

    Created by industry experts and meticulously reviewed

    The highest standards in reporting and publishing

    Strict editorial policy that focuses on accuracy, relevance, and impartiality

    Morbi pretium leo et nisl aliquam mollis. Quisque arcu lorem, ultricies quis pellentesque nec, ullamcorper eu odio.


    Este artículo también está disponible en español.

    Bitcoin is grappling with intensified volatility following a sharp selloff triggered by US President Donald Trump’s abrupt announcement of a sweeping 50% tariff on all EU imports starting June 1. The unexpected macroeconomic move sent shockwaves through assets, and Bitcoin was no exception, dropping aggressively from all-time highs near $111,800 to lows around $107,500 in a matter of hours. 

    Related Reading

    Although there was a brief recovery towards $109,000, the ensuing price action now shows an intense battle between the bulls and bears, with technical analysis on the 1-hour candlestick timeframe showing the two ways Bitcoin can play out this week.

    Bitcoin Compression Structure Between Fair Value Gaps

    According to crypto analyst TehThomas, Bitcoin’s current price structure is defined by two opposing 1-hour fair value gaps (FVGs). The lower FVG zone identified by the analyst is around $107,500, which showed up during the rally towards $111,814 ATH and is now acting as the first significant reaction point post-rally. 

    The upper FVG range is between $109,800 and $110,700. This level, previously the base of a breakdown candle, flipped into strong resistance on Friday. Interestingly, a rejection was confirmed inside this upper FVG, which showed there were many sellers present in that zone.

    Notably, the 1-hour chart shared by the analyst points to a deadlock scenario for the Bitcoin price. A breakout above or below the identified fair value gaps will likely define the directional bias for Bitcoin’s next major leg.

    BTC is now trading at $107,017. Chart: TradingView

    Bitcoin’s next impulsive move will likely come with volume confirmation, either with a bullish displacement above resistance or a bearish rejection that pushes the Bitcoin price toward a lower demand target.
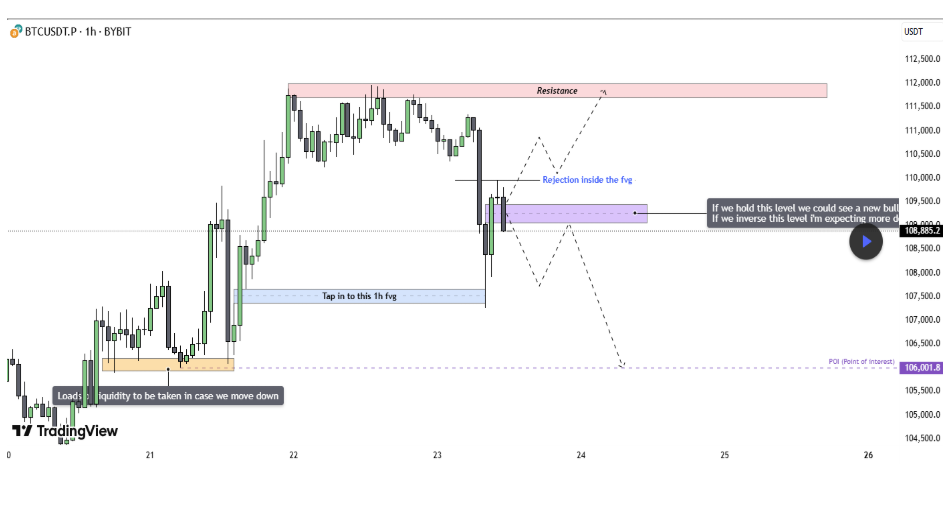
    Chart Image From TradingView

    Bullish And Bearish Scenarios For Bitcoin

    Interestingly, since the analysis, the ensuing price action has been marked by Bitcoin’s failure to reclaim the upper FVG and more of a consolidation around the lower FVG at $107,500. This places the most significance around this level, as Bitcoin’s reaction here could either cause a rebound upwards or a significant price retracement.

    For the bullish scenario, a bounce at the lower FVG will send the Bitcoin price towards the upper FVG. A sustained move above the upper FVG at $110,700 would indicate a bullish reclaim and might bring a new all-time high around $113,000 back into focus. 

    Related Reading

    For the bearish scenario, especially with a clean loss of the $107,500 level, the path opens for a move toward $106,000.  This level is aligned with a liquidity pool left behind from consolidation early last week. If the structure breaks downward below $106,000, sellers may seize control in the short term.

    At the time of writing, Bitcoin was trading at $107,017.

    Featured image from Unsplash, chart from TradingView

    Source link

    Share. Facebook Twitter Pinterest LinkedIn Tumblr Email Copy Link
    Previous ArticleEthereum Bullish Pattern Points To Immediate $3,000 Target – Details
    Next Article Active DeFi loans hit all-time high at $23.7B as TVL nears pre-tariff levels
    Anthony M. Orbison
    • Website

    Related Posts

    Trader Predicts Rallies for Ethereum Amid Trump’s ‘Tariff Tantrum,’ Forecasts New All-Time High for ETH-Based Memecoin

    May 26, 2025

    James Wynn takes $5.3m loss, bets $1.2b on Bitcoin lifeline

    May 26, 2025

    Ethereum (ETH) Could Hit $3,000 Sooner Than Expected

    May 26, 2025
    Leave A Reply Cancel Reply

    Amazon.com, Inc.
    $200.99
    $2.11
    1.04%
    Meta Platforms, Inc.
    $627.06
    $9.51
    1.49%
    S&P 500
    $5,802.82
    $39.19
    0.67%
    Alphabet Inc.
    $169.59
    $2.39
    1.39%
    EUR/USD
    $1.14
    $0.0042
    0.37%
    EUR/JPY
    $162.59
    $0.577
    0.36%
    USD/CAD
    $1.37
    $0.0033
    0.24%

    Risk Disclosure: Trading in financial instruments and/or cryptocurrencies involves high risks including the risk of losing some, or all, of your investment amount, and may not be suitable for all investors. Prices of cryptocurrencies are extremely volatile and may be affected by external factors such as financial, regulatory or political events. Trading on margin increases the financial risks.
    Before deciding to trade in financial instrument or cryptocurrencies you should be fully informed of the risks and costs associated with trading the financial markets, carefully consider your investment objectives, level of experience, and risk appetite, and seek professional advice where needed.
    Fusion Media would like to remind you that the data contained in this website is not necessarily real-time nor accurate. The data and prices on the website are not necessarily provided by any market or exchange, but may be provided by market makers, and so prices may not be accurate and may differ from the actual price at any given market, meaning prices are indicative and not appropriate for trading purposes. Fusion Media and any provider of the data contained in this website will not accept liability for any loss or damage as a result of your trading, or your reliance on the information contained within this website.
    It is prohibited to use, store, reproduce, display, modify, transmit or distribute the data contained in this website without the explicit prior written permission of Fusion Media and/or the data provider. All intellectual property rights are reserved by the providers and/or the exchange providing the data contained in this website.
    Fusion Media may be compensated by the advertisers that appear on the website, based on your interaction with the advertisements or advertisers.
    We're social. Connect with us:

    Facebook X (Twitter)
    • Home
    • About us
    • Contact
    • Disclaimer
    • Privacy Policy
    © 2025 Marketsnews.co.uk

    Type above and press Enter to search. Press Esc to cancel.