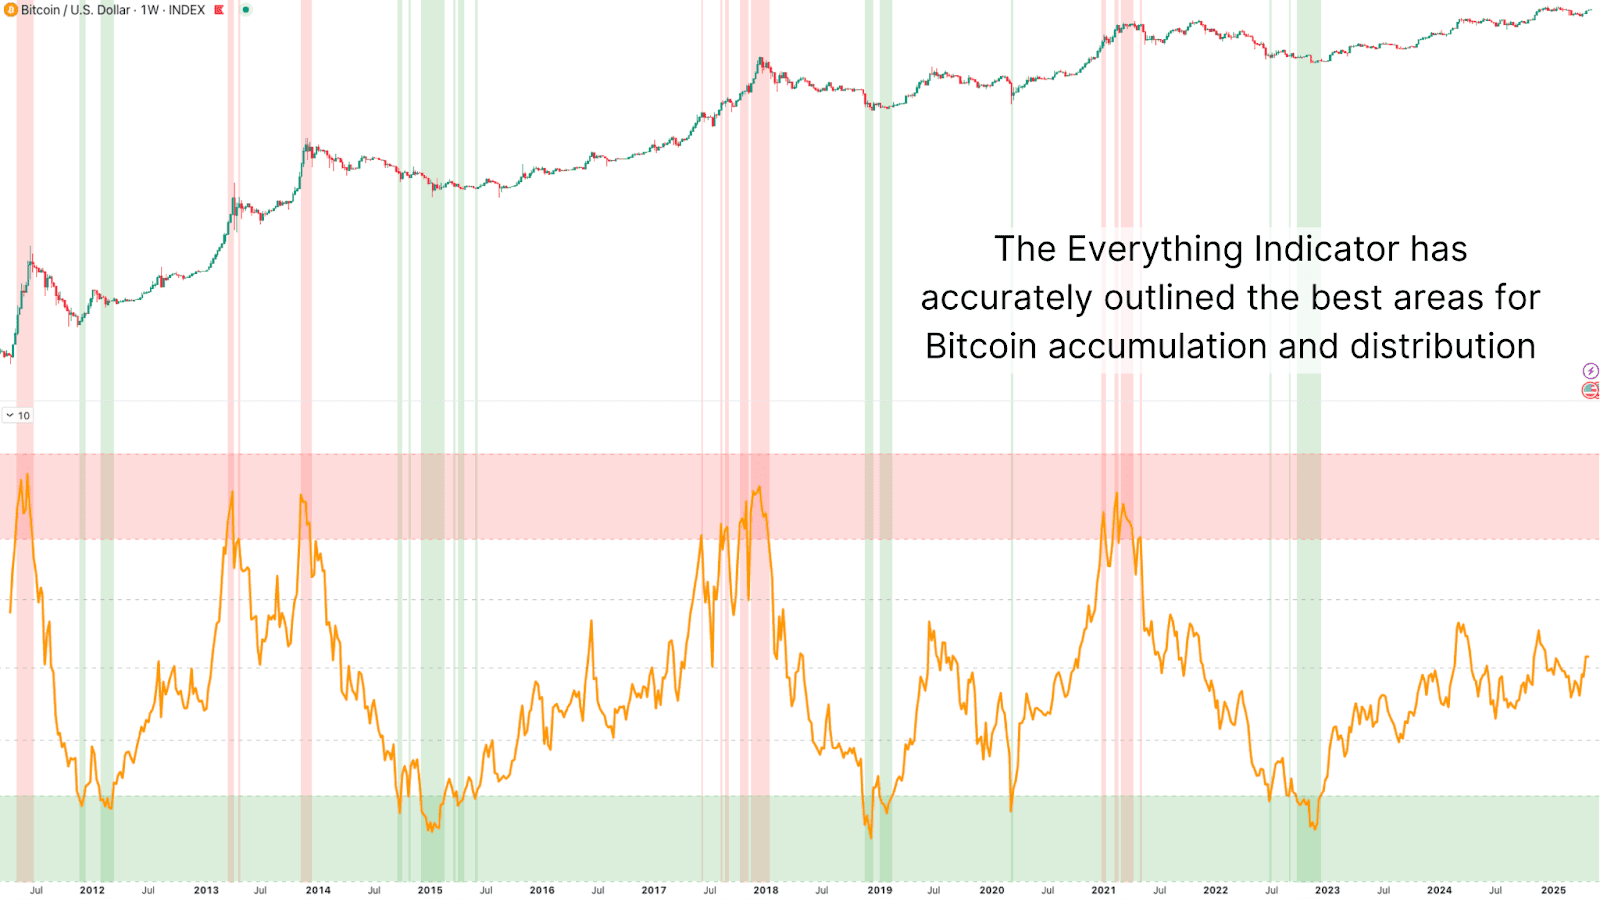
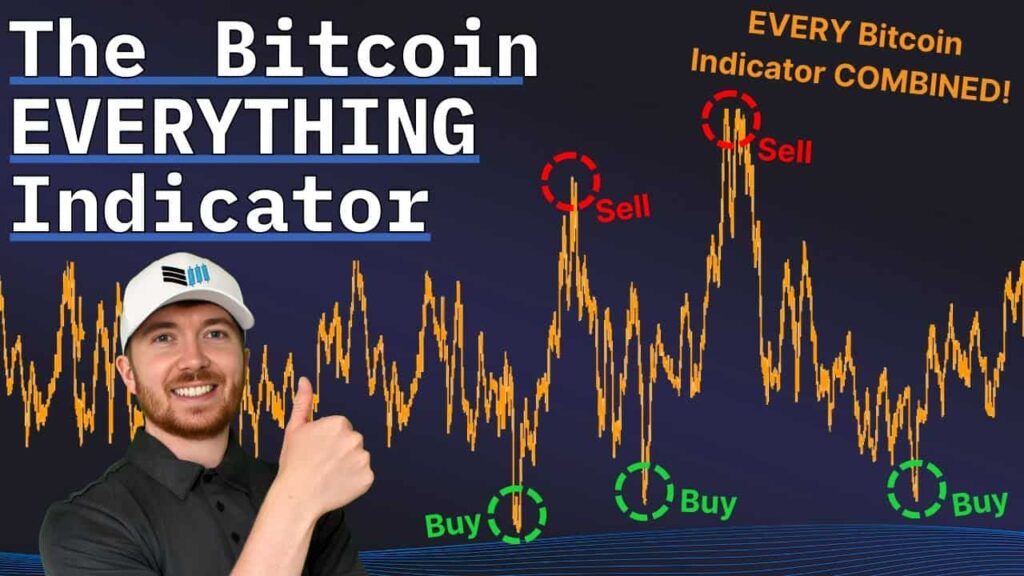
The Bitcoin Everything Indicator was designed to provide a comprehensive view of all major forces impacting BTC price action, on-chain, macro, technical, and fundamental. Since its creation, it has proven remarkably accurate at marking both cycle tops and bottoms. But today, we take it a step further.
In this article, we’ll explore how this already-powerful tool can be upgraded with a simple modification to give more frequent, actionable insights, without compromising its core integrity. If you’re looking for a high-signal way to approach the Bitcoin market more actively, this might be the metric you’ve been waiting for.
What Is the Bitcoin Everything Indicator?
Originally built as a composite tool, the Bitcoin Everything Indicator is constructed from several uncorrelated signals:
Together, these data points are equal-weighted, not overfitted, creating an aggregate score that tracks broad BTC market dynamics. Importantly, it doesn’t rely on any single model or indicator. Instead, it captures the confluence of multiple domains that collectively shape Bitcoin price movements. Backtesting shows that the indicator consistently highlights macro turning points, including cycle tops and capitulation bottoms, across all major Bitcoin cycles.
Infrequent But Strong Signals
While accurate, the original Everything Indicator was inherently long-term. Signals would only appear every few years, marking the major inflection points of each bull and bear market. For investors looking to buy generational lows or scale out at macro tops, it was invaluable.

But for those aiming to be more active, strategically DCA-ing, rotating capital, or even managing risk with mid-cycle exits, it offered little day-to-day guidance. The solution? Increase signal resolution without sacrificing the macro integrity of the model.
Adding A Moving Average
The improvement is elegantly simple: apply a moving average to the Everything Indicator score and look for crossovers. Just as we do with price-based strategies, we can treat the indicator like a signal line and look for directional changes.
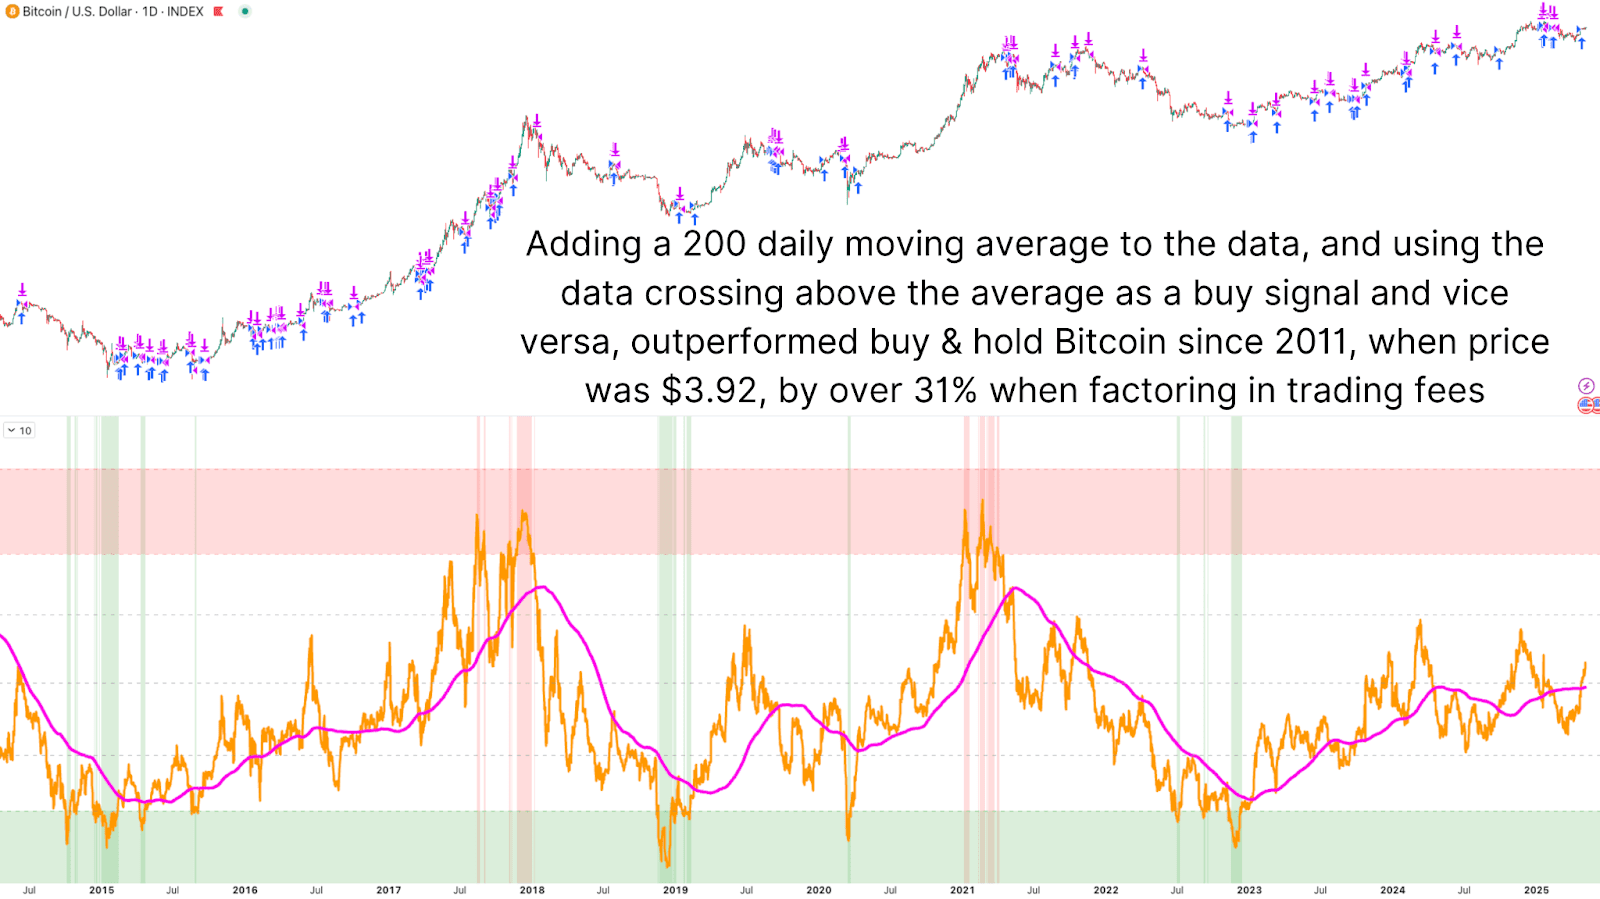
By default, a 200-period simple moving average was applied. When the Everything Indicator crosses above this MA, it suggests that most components, liquidity, network health, sentiment, and technicals, are trending upward together. These crossovers signal bullish trend initiation, offering earlier entries than waiting for cycle lows alone. Conversely, a cross below the moving average can serve as a de-risking or distribution signal, especially when occurring at or near previously identified overheated zones.

Even with conservative trading assumptions (increased fees and slippage), this strategy’s performance was striking. Backtests from Bitcoin’s early years, when BTC traded under $4, showed this crossover strategy returning over 3.1 million percent, dramatically outperforming simple buy-and-hold.
Increased Signal Frequency
To accommodate more active investors, we can further shorten the moving average, down to 20 periods, for example. This provides hundreds of entry and exit signals per cycle while retaining the original logic of the indicator.
Even when using the shorter-term signal, returns remained strong, and outperformance relative to holding BTC remained intact. This shows the tool’s flexibility. It can now serve both long-term investors looking for macro confirmation and active traders who want to respond more dynamically to market changes.

Reducing the moving average period has key benefits, including generating earlier signals at market lows, more frequent accumulation guidance, regular exit prompts during overheated conditions, and increased opportunities to avoid prolonged drawdowns.
Conclusion
The Bitcoin Everything Indicator could now offer the best of both worlds: a high-integrity, all-encompassing view of market health, and the flexibility to offer frequent actionable signals through a simple moving average overlay. Even with real-world trading friction, with fees and slippage, this strategy has outperformed holding BTC over multiple timeframes, including from as far back as 2011.
So if you’re already using Bitcoin Magazine Pro’s suite of indicators, now might be the time to take this one step further. Add overlays. Adjust moving averages. Layer in bands and filters. The more you adapt these tools to your own strategy, the more powerful and intuitive they can become!
For more deep-dive research, technical indicators, real-time market alerts, and access to a growing community of analysts, visit BitcoinMagazinePro.com.

Disclaimer: This article is for informational purposes only and should not be considered financial advice. Always do your own research before making any investment decisions.
