Close Menu
    What's Hot

    Crypto Exchange Coinbase Adds Gold-Pegged Stablecoin PAXG to Listing Roadmap

    Shiba Inu pattern points to 190% surge as burn rate rises

    SOL’s Price If Its Market Cap Equals Ethereum

    Facebook X (Twitter) Instagram
    MarketsNews.co.uk
    • Live Chart
    • Brokers
    • Scam Broker
    • Reviews
    • Tools
      • Lot Size Calculator
      • Margin Calculator
      • PIPS Calculator
      • Profit & loss calculator
    Facebook X (Twitter) Instagram
    Start Trading
    Trending Topics:
    • Markets
    • Stocks
    • Cryptocurrency
    • Forex
    • Scam Broker
    MarketsNews.co.uk
    • Markets
    • Stocks
    • Cryptocurrency
    • Forex
    • Scam Broker
    Cryptocurrency

    Fantom price prediction – Mixed market signals could push FTM THIS way!

    Anthony M. OrbisonBy Anthony M. OrbisonOctober 29, 2024No Comments3 Mins Read
    Share Facebook Twitter Pinterest Copy Link Telegram LinkedIn Tumblr Email
    Share
    Facebook Twitter LinkedIn Pinterest Email
    • FTM’s bullish trend persisted within an ascending channel, with key resistance at $0.7955
    • Mixed on-chain signals underlined cautious optimism as liquidations had their say

    Fantom’s [FTM] price jumped by 6.31% over the past 24 hours to trade at $0.6786 at press time. It boasted a $1.90 billion market cap, alongside a 24-hour volume surge of 68.26%, hitting $142.91M.

    The altcoin’s prevailing price action keeps FTM within an ascending channel, eyeing resistance levels at $0.7955 and $0.9330. Therefore, in light of the market momentum gaining, investors should wonder – Can Fantom (FTM) hold this bullish trend?

    Analyzing the ascending channel – Will this support hold?

    FTM’s trajectory within the ascending channel highlighed a clear bullish trend. The channel’s structure suggested FTM could maintain upward momentum, if it respects the support and resistance boundaries. 

    Additionally, breaking above the $0.7955 resistance would reinforce bullish sentiment, possibly pushing the price towards the next level at $0.9330. 
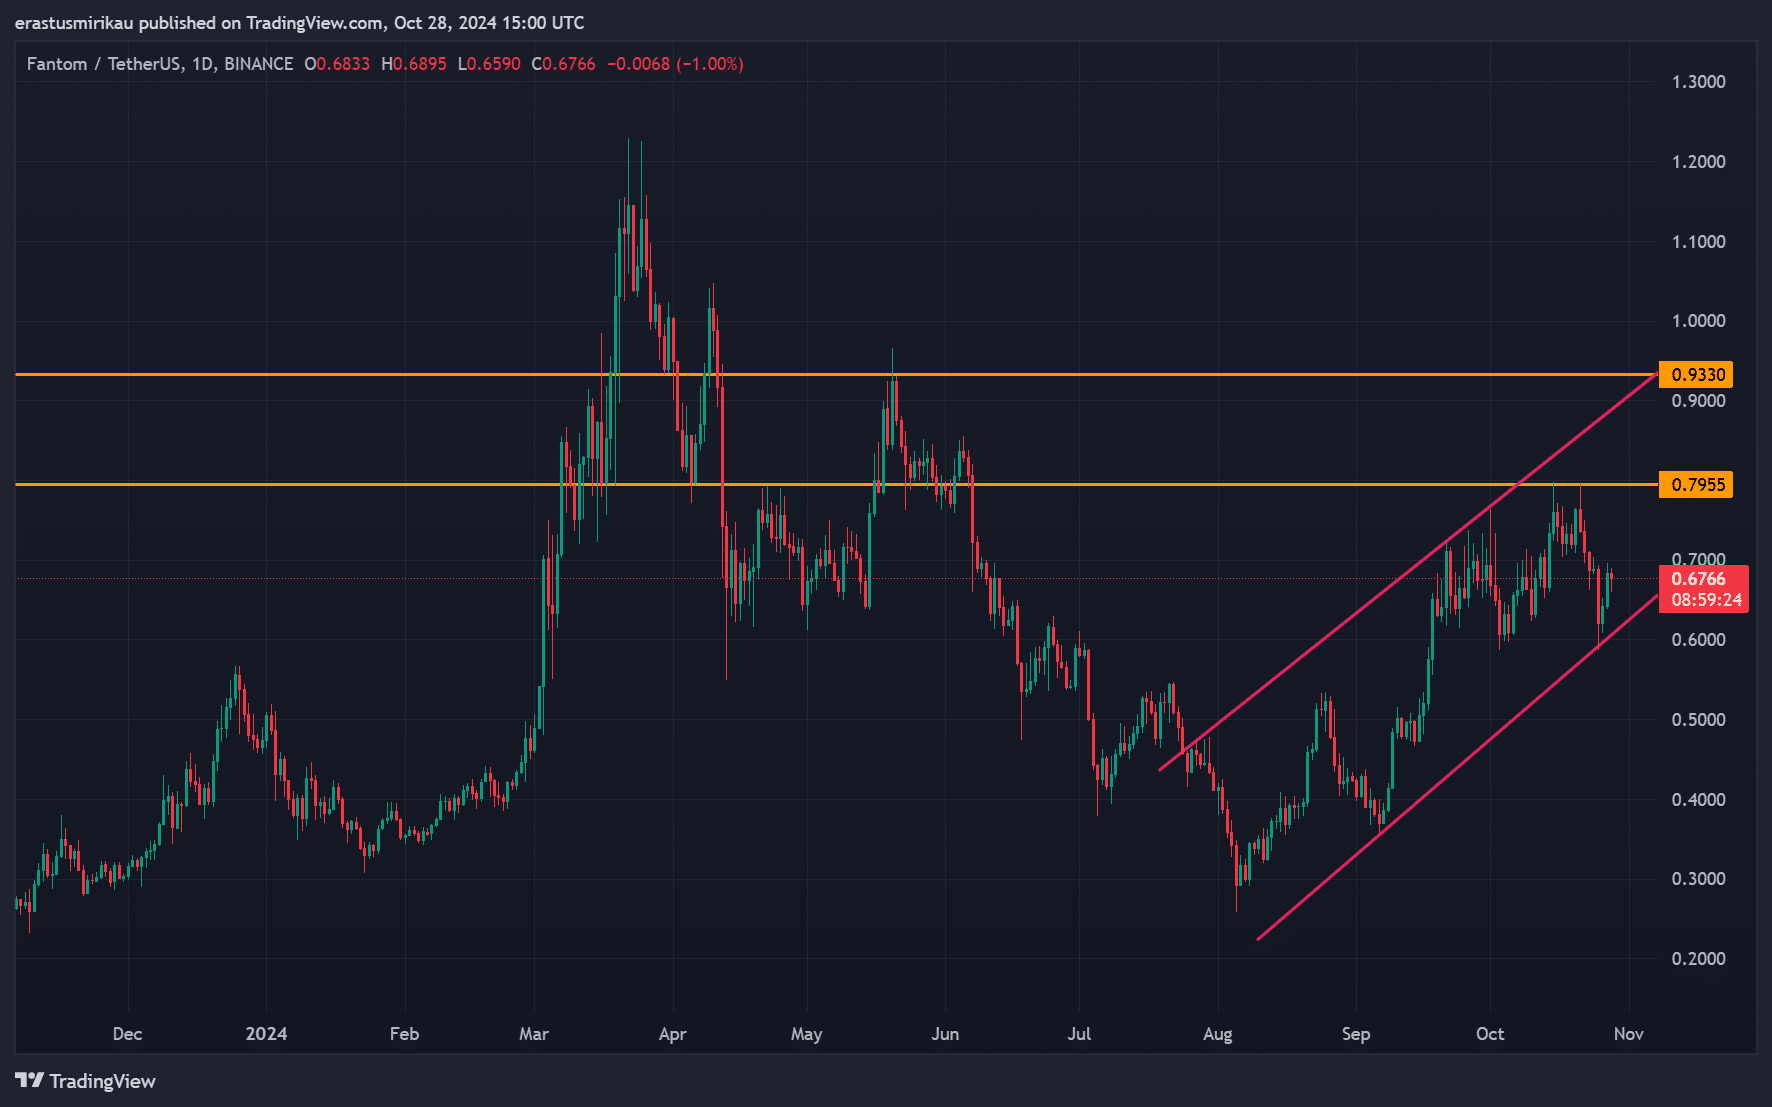
    FTM chart analysis

    Source: TradingView

    Bollinger bands and RSI’s findings

    At press time, the Bollinger Bands seemed to be widening, indicating a surge in volatility as FTM approached the upper band. Such an expansion generally signifies that buyers are dominating the trend. Consequently, if the price continues hugging the upper band, it alludes to a potential breakout to new highs. 

    The Relative Strength Index (RSI), with a value near 54.72 at press time, remained in the neutral zone. This suggested that FTM has further room to climb without facing overbought conditions. Simply put, the press time RSI level supported the possibility of additional gains if buying volume persists.
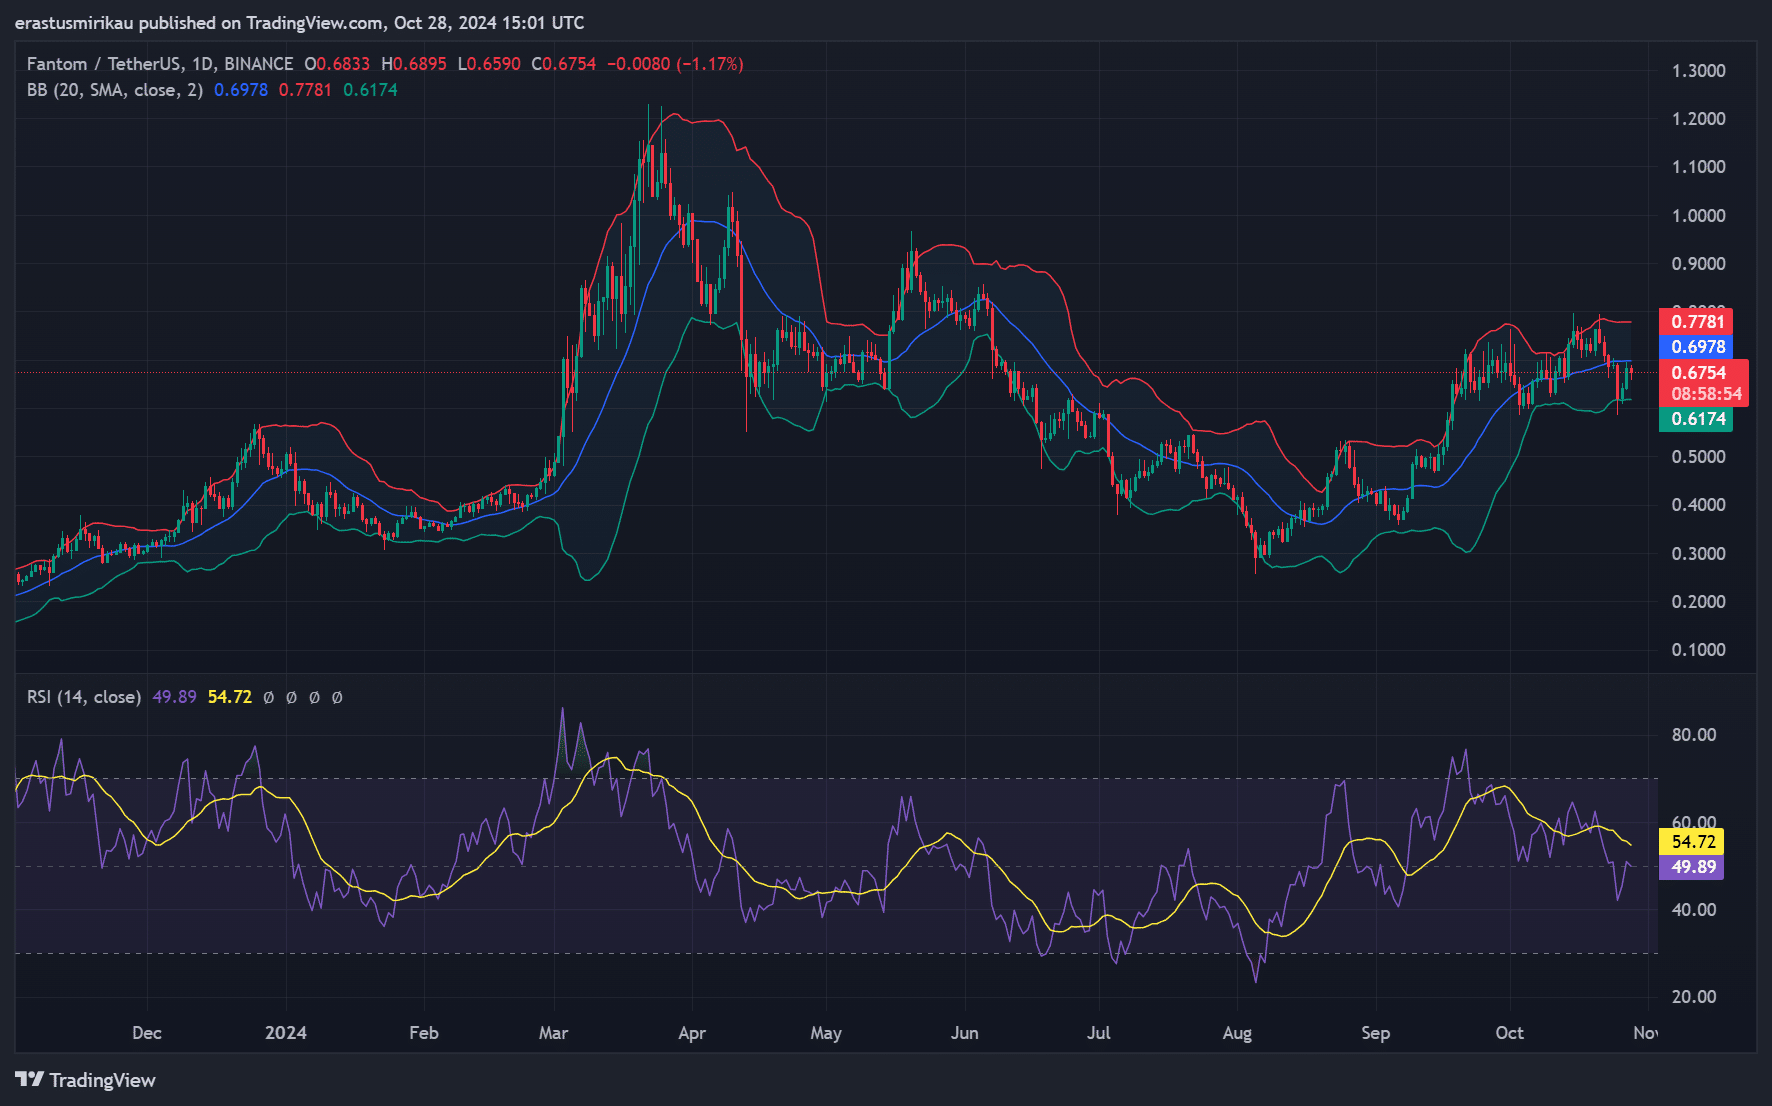
    FTM technical analysisFTM technical analysis

    Source: TradingView

    Price DAA divergence – A potential red flag?

    The Price DAA (Daily Active Addresses) Divergence underlined a concerning -79.72% reading, suggesting fewer active addresses despite recent price hikes. This discrepancy also highlighted a lack of underlying network growth – Often a sign of reduced sustainability for the rally. 

    Additionally, fewer active addresses may weaken FTM’s foundation in the event of greater selling pressure. This might also urge traders to watch for a potential pullback, if address activity fails to rebound.
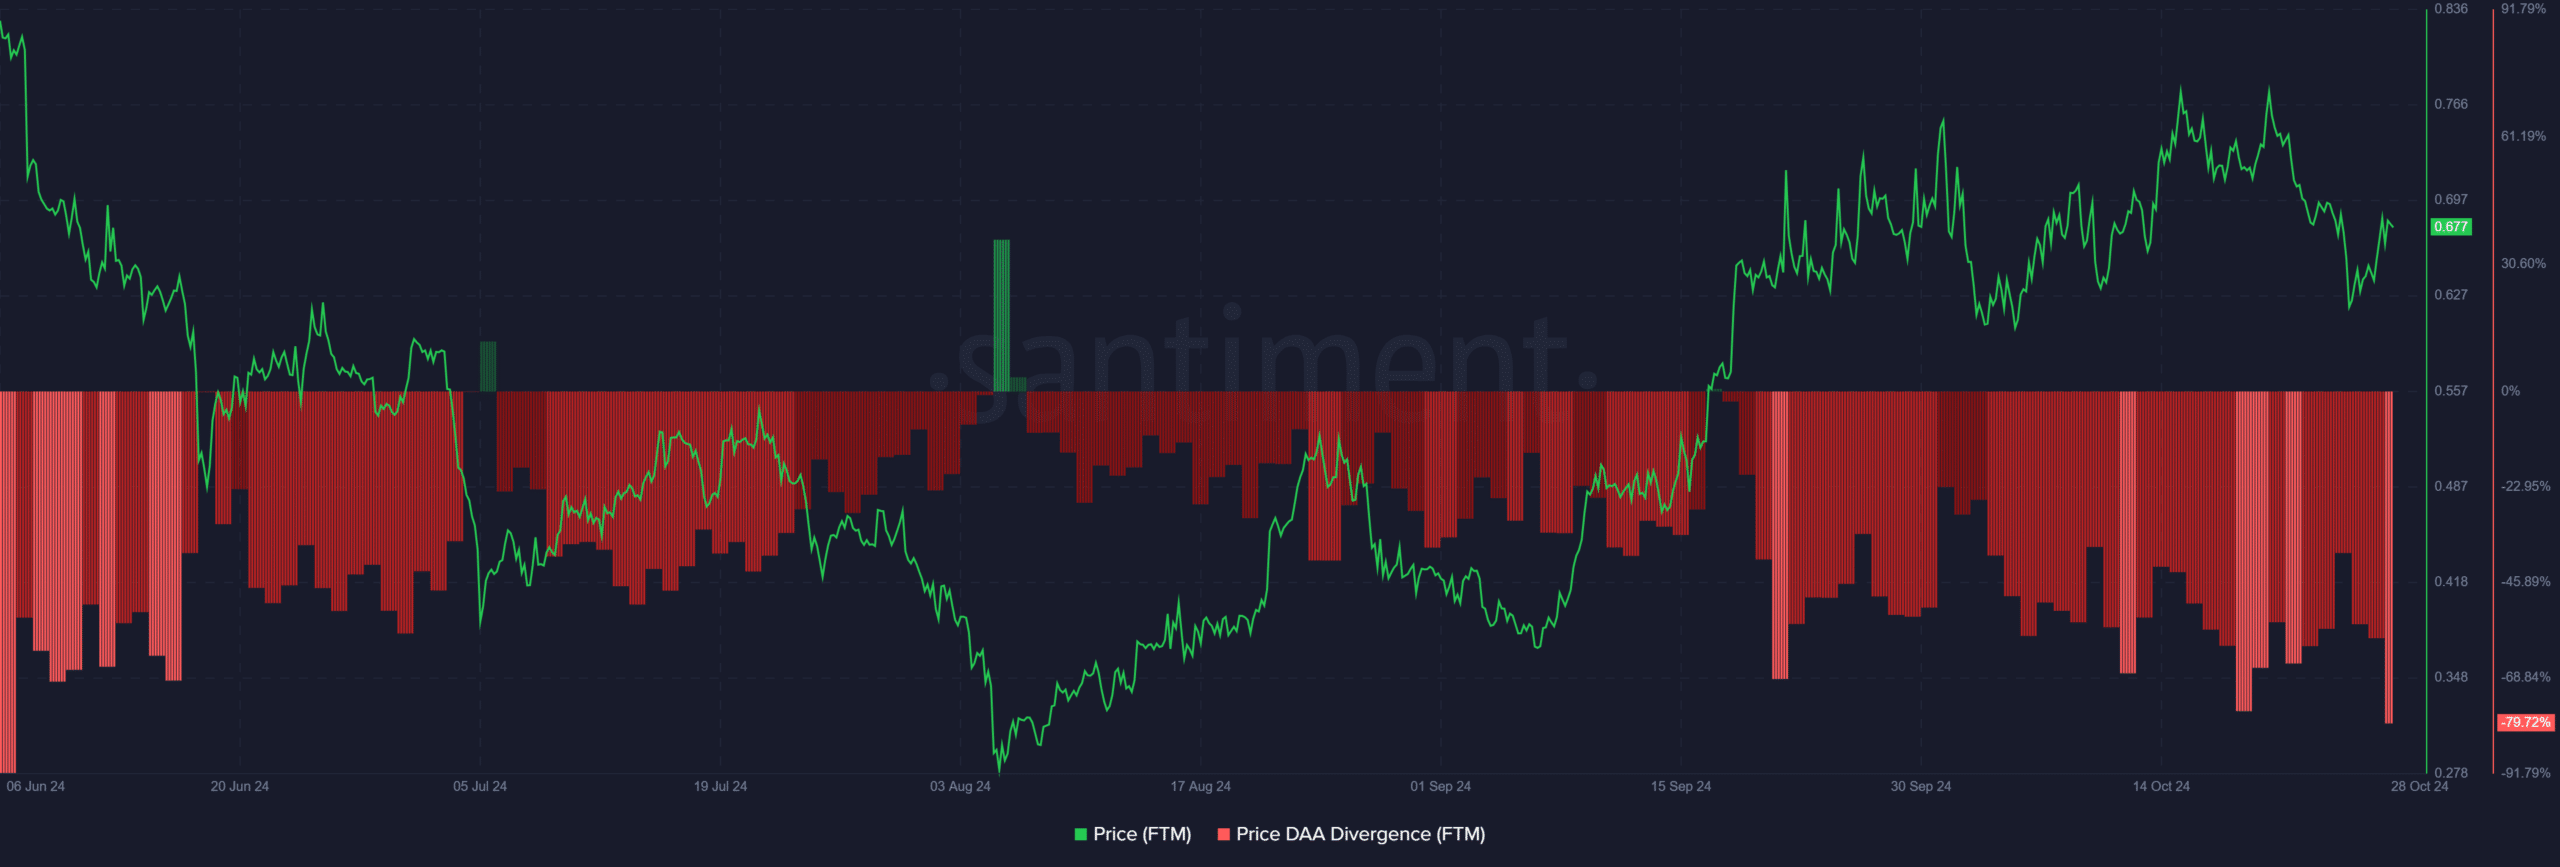
    Source: Santiment

    FTM On-chain signals – Mixed sentiment?

    Fantom’s on-chain data presented mixed signals. Net Network Growth stood at a modest 0.16%, indicating gradual adoption. Meanwhile, the concentration of large holders rose by 0.04%, showing that major investors are not offloading positions – Typically a bullish indicator. Large Transactions also saw a 1.38% decrease, hinting at lower sell-off pressure from whales. 

    However, the “In the Money” metric revealed a slight bearish tilt at -0.79%, indicating a small fall in profitable positions. Consequently, these mixed on-chain signals reflected cautious optimism, with investors closely monitoring market sentiment shifts.

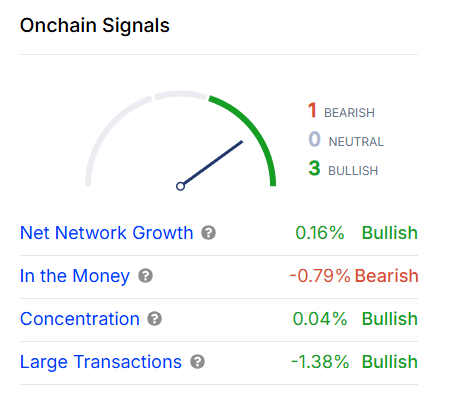
    Source: IntoTheBlock

    FTM liquidations- Short traders face pressure

    Finally, FTM’s liquidation data showed that short positions recorded significant liquidations of $162.78k, with long liquidations lower at $95.54k.

    Consequently, this pattern projected bearish sentiment among short traders, misjudging the price trend. If FTM maintains strength above $0.67, further short liquidations could drive the price higher.
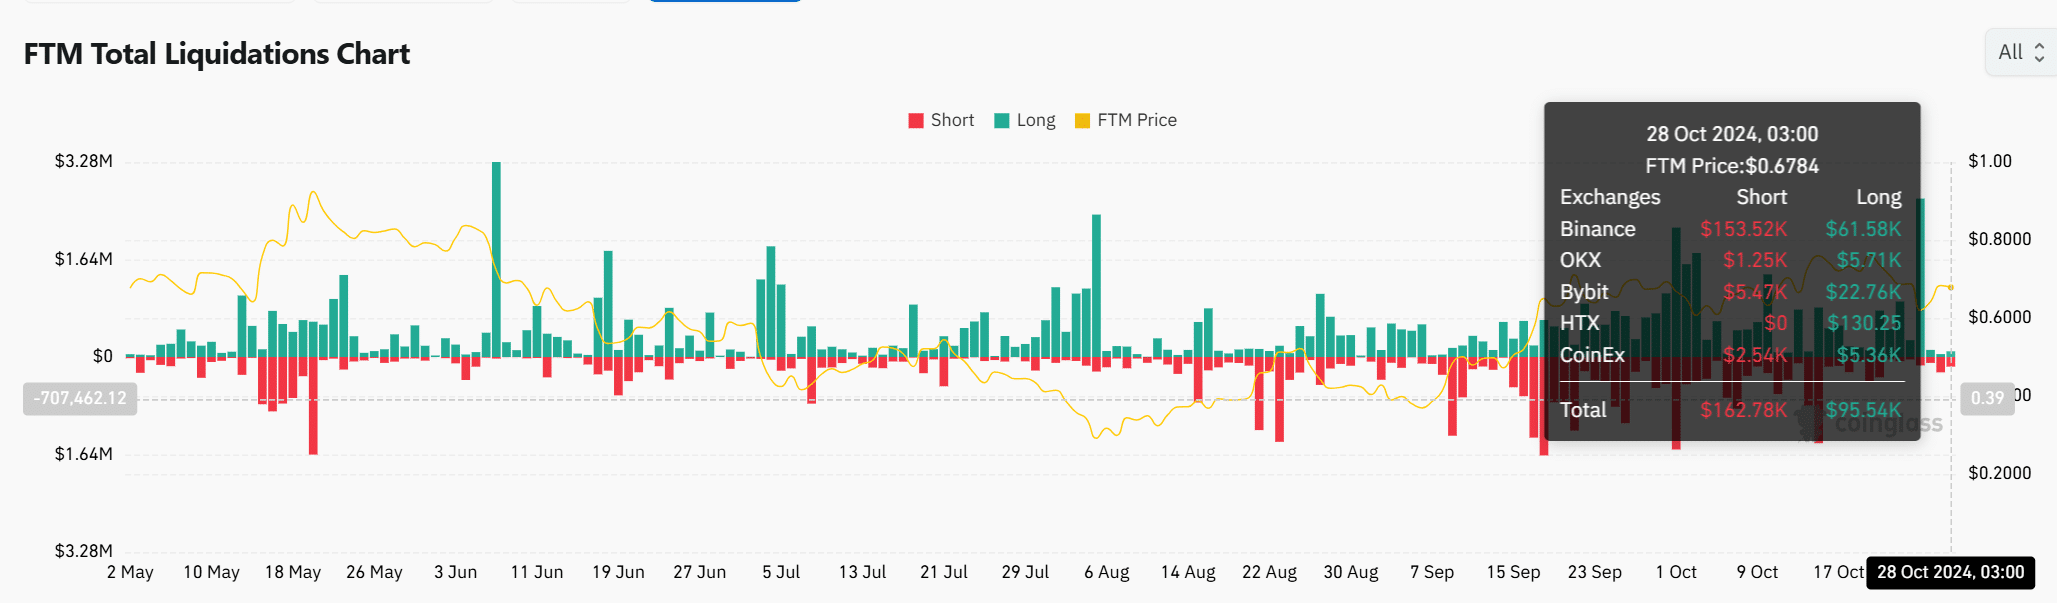
    Source: Coinglass


    Read Fantom’s [FTM] Price Prediction 2024-25


    Fantom’s press time momentum, paired with supportive technical indicators and a balanced on-chain picture, flashed a positive outlook for the altcoin.

    However, the Price DAA Divergence and the slightly bearish “In the Money” metric implied caution. If FTM clears the $0.7955 resistance with sustained volume, it may continue its rally towards new highs within the channel.

    Previous: Here’s what AVAX buyers should know before they go long
    Next: Litecoin price prediction – Buyers, is it time to wait for a breakout?

    Source link

    Share. Facebook Twitter Pinterest LinkedIn Tumblr Email Copy Link
    Previous ArticleHizbollah appoints new leader after Nasrallah assassination
    Next Article Tesla Q3 earns praise, scrutiny from bears and bulls; GM results perk up institutional ears
    Anthony M. Orbison
    • Website

    Related Posts

    Crypto Exchange Coinbase Adds Gold-Pegged Stablecoin PAXG to Listing Roadmap

    May 12, 2025

    Shiba Inu pattern points to 190% surge as burn rate rises

    May 12, 2025

    SOL’s Price If Its Market Cap Equals Ethereum

    May 12, 2025
    Leave A Reply Cancel Reply

    Amazon.com, Inc.
    $193.06
    $0.98
    0.51%
    Meta Platforms, Inc.
    $592.49
    $5.52
    0.92%
    S&P 500
    $5,659.91
    $4.03
    0.07%
    Alphabet Inc.
    $154.38
    $1.37
    0.88%
    EUR/USD
    $1.12
    $0.0019
    0.17%
    EUR/JPY
    $163.85
    $0.328
    0.20%
    USD/CAD
    $1.39
    $0.0013
    0.09%

    Risk Disclosure: Trading in financial instruments and/or cryptocurrencies involves high risks including the risk of losing some, or all, of your investment amount, and may not be suitable for all investors. Prices of cryptocurrencies are extremely volatile and may be affected by external factors such as financial, regulatory or political events. Trading on margin increases the financial risks.
    Before deciding to trade in financial instrument or cryptocurrencies you should be fully informed of the risks and costs associated with trading the financial markets, carefully consider your investment objectives, level of experience, and risk appetite, and seek professional advice where needed.
    Fusion Media would like to remind you that the data contained in this website is not necessarily real-time nor accurate. The data and prices on the website are not necessarily provided by any market or exchange, but may be provided by market makers, and so prices may not be accurate and may differ from the actual price at any given market, meaning prices are indicative and not appropriate for trading purposes. Fusion Media and any provider of the data contained in this website will not accept liability for any loss or damage as a result of your trading, or your reliance on the information contained within this website.
    It is prohibited to use, store, reproduce, display, modify, transmit or distribute the data contained in this website without the explicit prior written permission of Fusion Media and/or the data provider. All intellectual property rights are reserved by the providers and/or the exchange providing the data contained in this website.
    Fusion Media may be compensated by the advertisers that appear on the website, based on your interaction with the advertisements or advertisers.
    We're social. Connect with us:

    Facebook X (Twitter)
    • Home
    • About us
    • Contact
    • Disclaimer
    • Privacy Policy
    © 2025 Marketsnews.co.uk

    Type above and press Enter to search. Press Esc to cancel.