Close Menu
    What's Hot

    Is Bitcoin about to go parabolic? BTC price targets include $160K next

    Enhanced Bitcoin Everything Indicator Boosts Profits

    Gemini to launch crypto derivatives in Europe with new license

    Facebook X (Twitter) Instagram
    MarketsNews.co.uk
    • Live Chart
    • Brokers
    • Scam Broker
    • Reviews
    • Tools
      • Lot Size Calculator
      • Margin Calculator
      • PIPS Calculator
      • Profit & loss calculator
    Facebook X (Twitter) Instagram
    Start Trading
    Trending Topics:
    • Markets
    • Stocks
    • Cryptocurrency
    • Forex
    • Scam Broker
    MarketsNews.co.uk
    • Markets
    • Stocks
    • Cryptocurrency
    • Forex
    • Scam Broker
    Cryptocurrency

    Is Bitcoin Price Performance In 2025 Repeating 2017 Bull Cycle?

    Anthony M. OrbisonBy Anthony M. OrbisonMarch 21, 2025No Comments4 Mins Read
    Share Facebook Twitter Pinterest Copy Link Telegram LinkedIn Tumblr Email
    Share
    Facebook Twitter LinkedIn Pinterest Email

    After reaching an all-time high above $100,000, the Bitcoin price has entered a multi-week downtrend. This correction has naturally raised questions about whether Bitcoin is still aligned with the 2017 bull cycle. Here we’ll analyze the data to assess how closely Bitcoin’s current price action correlates with previous bull markets, and what we can expect next for BTC.

    Bitcoin Price Trends in 2025 vs. 2017 Bull Cycle

    Bitcoin’s price trajectory since the cycle lows set during the 2022 bear market has shown remarkable similarities to the 2015–2017 cycle, the bull market that culminated in Bitcoin reaching $20,000 in December 2017. However, Bitcoin’s recent downtrend marks the first major divergence from the 2017 pattern. If Bitcoin were still tracking the 2017 cycle, it should have been rallying to new all-time highs over the past month, instead, Bitcoin has been moving sideways and declining, suggesting that the correlation may be weakening.

    Figure 1: The current cycle trajectory has recently diverged from historical patterns.

    View Live Chart 🔍

    Despite the recent divergence, the historical correlation between Bitcoin’s current cycle and the 2017 cycle remains surprisingly high. The correlation between the current cycle and the 2015–2017 cycle was around 92% earlier this year. The recent price divergence has reduced the correlation slightly to 91%, still an extremely high figure for financial markets.

    How Bitcoin Market Behavior Echoes 2017 Cycle Patterns

    The MVRV Ratio is a key indicator of investor behavior. It measures the relationship between Bitcoin’s current market price and the average cost basis of all BTC held on the network. When the MVRV ratio rises sharply, it indicates that investors are sitting on significant unrealized profits, a condition that often precedes market tops. When the ratio declines toward the realized price, it signals that Bitcoin is trading close to the average acquisition price of investors, often marking a bottoming phase.
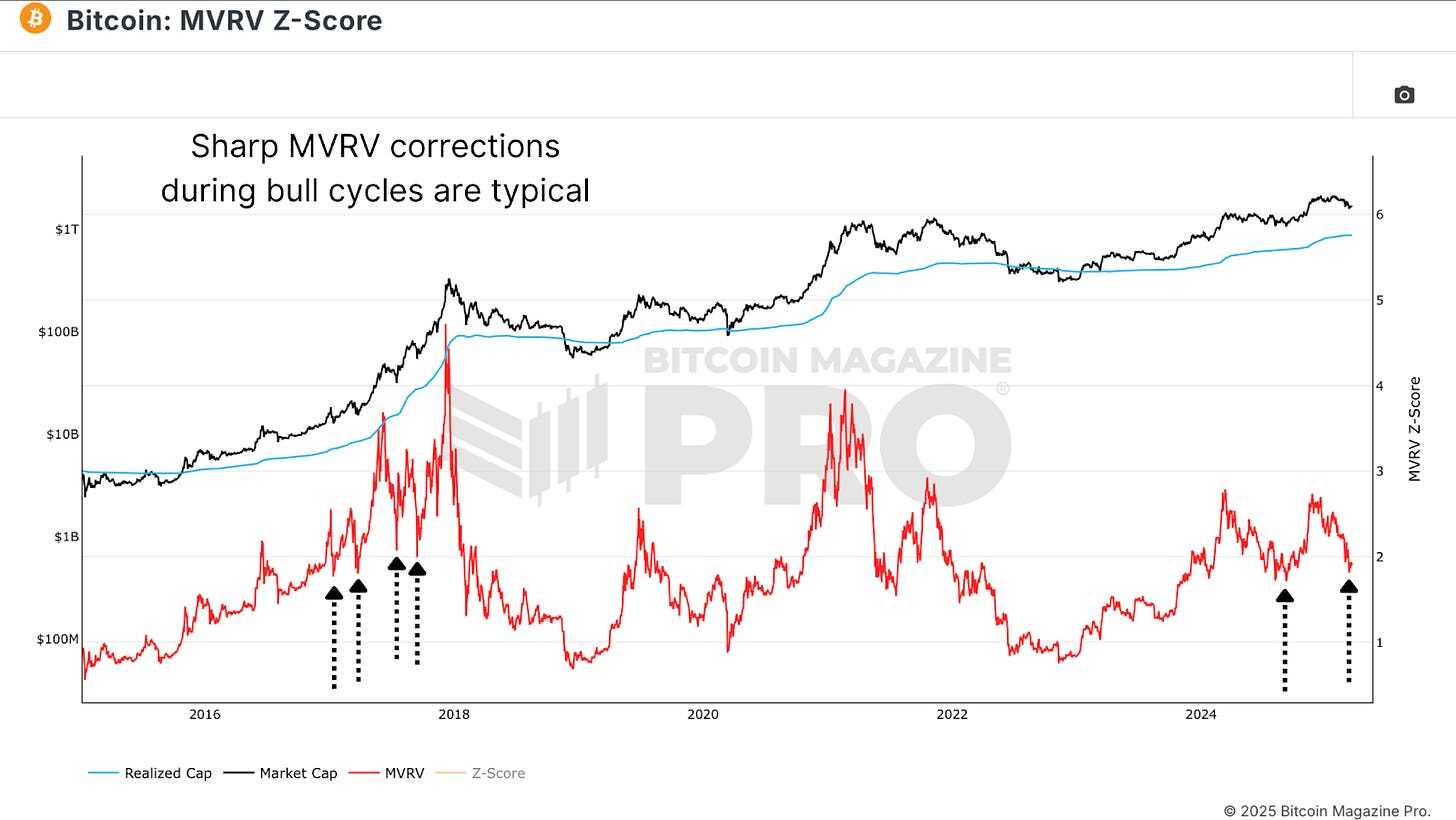
    Figure 2: The MVRV Ratio is still moving similarly to the 2017 cycle.

    View Live Chart 🔍

    The recent decline in the MVRV ratio reflects Bitcoin’s correction from all-time highs, however, the MVRV ratio remains structurally similar to the 2017 cycle with an early bull market rally, followed by multiple sharp corrections, and as such, the correlation remains at 80%.

    Bitcoin Price Correlation with 2017 Bull Cycle Data

    One possible explanation for the recent divergence is the influence of data lag. For example, Bitcoin’s price action has shown a strong correlation with Global Liquidity, the total supply of money in major economies; however, historical analysis shows that changes in liquidity often take around 2 months to reflect in Bitcoin’s price action.
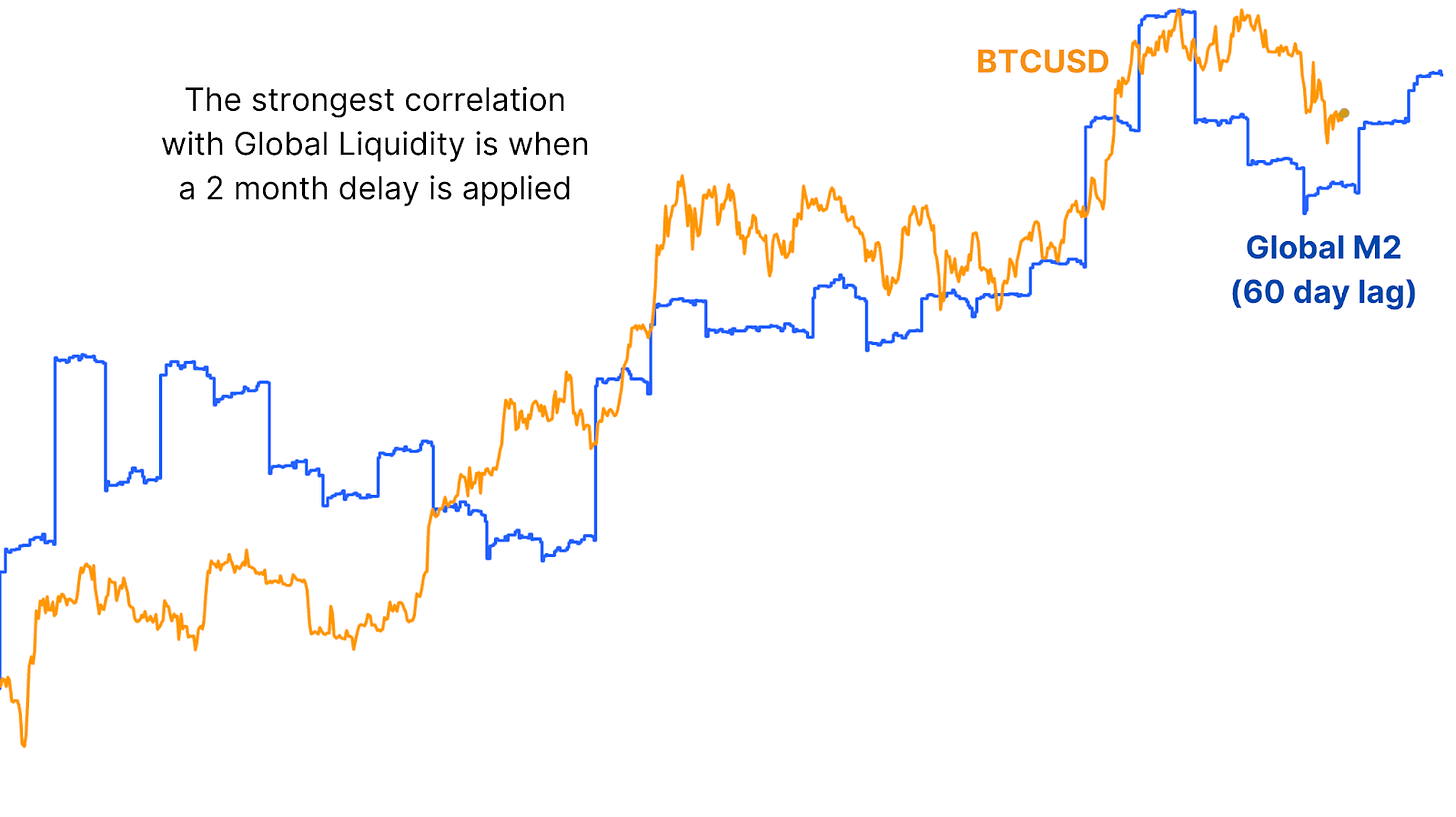
    Figure 3: Global M2 has a delayed impact on BTC price action.

    View Live Chart 🔍

    By applying a 30-day lag to Bitcoin’s price action relative to the 2017 cycle, the correlation increases to 93%, which would be the highest recorded correlation between the two cycles. The lag-adjusted pattern suggests that Bitcoin could soon resume the 2017 trajectory, implying that a major rally could be on the horizon.
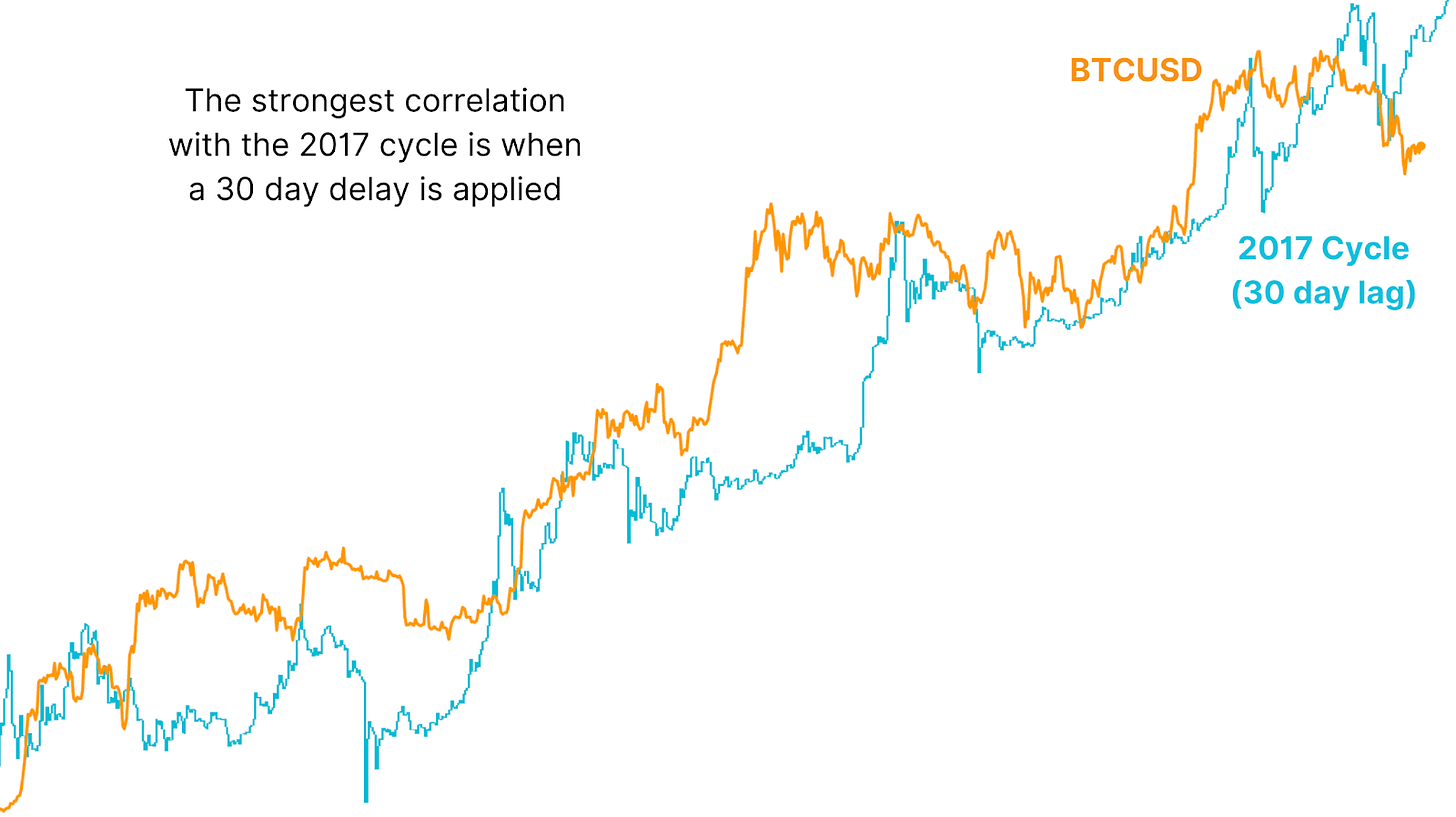
    Figure 4: Price is still very closely following the 2017 data when delayed by 30 days.

    What 2017 Bull Cycle Signals Mean for Bitcoin Price Today

    History may not repeat itself, but it often rhymes. Bitcoin’s current cycle may not deliver 2017-style exponential gains, but the underlying market psychology remains strikingly similar. If Bitcoin resumes its correlation with the lagging 2017 cycle, the historical precedent suggests that Bitcoin could soon recover from the current correction, and a sharp upward move could follow.

    Explore live data, charts, indicators, and in-depth research to stay ahead of Bitcoin’s price action at Bitcoin Magazine Pro.

    Disclaimer: This article is for informational purposes only and should not be considered financial advice. Always do your own research before making any investment decisions.

    Source link

    Share. Facebook Twitter Pinterest LinkedIn Tumblr Email Copy Link
    Previous ArticleIs Bitcoin price going to crash again?
    Next Article Is Bitcoin going to $65K? Traders explain why they’re still bearish
    Anthony M. Orbison
    • Website

    Related Posts

    Is Bitcoin about to go parabolic? BTC price targets include $160K next

    May 9, 2025

    Enhanced Bitcoin Everything Indicator Boosts Profits

    May 9, 2025

    Gemini to launch crypto derivatives in Europe with new license

    May 9, 2025
    Leave A Reply Cancel Reply

    Amazon.com, Inc.
    $192.10
    $0.02
    0.01%
    Meta Platforms, Inc.
    $598.50
    $0.49
    0.08%
    S&P 500
    $5,662.22
    $1.72
    0.03%
    Alphabet Inc.
    $154.88
    $0.87
    0.56%
    EUR/USD
    $1.13
    $0.0044
    0.39%
    EUR/JPY
    $163.59
    $0.129
    0.08%
    USD/CAD
    $1.39
    $0.0004
    0.03%

    Risk Disclosure: Trading in financial instruments and/or cryptocurrencies involves high risks including the risk of losing some, or all, of your investment amount, and may not be suitable for all investors. Prices of cryptocurrencies are extremely volatile and may be affected by external factors such as financial, regulatory or political events. Trading on margin increases the financial risks.
    Before deciding to trade in financial instrument or cryptocurrencies you should be fully informed of the risks and costs associated with trading the financial markets, carefully consider your investment objectives, level of experience, and risk appetite, and seek professional advice where needed.
    Fusion Media would like to remind you that the data contained in this website is not necessarily real-time nor accurate. The data and prices on the website are not necessarily provided by any market or exchange, but may be provided by market makers, and so prices may not be accurate and may differ from the actual price at any given market, meaning prices are indicative and not appropriate for trading purposes. Fusion Media and any provider of the data contained in this website will not accept liability for any loss or damage as a result of your trading, or your reliance on the information contained within this website.
    It is prohibited to use, store, reproduce, display, modify, transmit or distribute the data contained in this website without the explicit prior written permission of Fusion Media and/or the data provider. All intellectual property rights are reserved by the providers and/or the exchange providing the data contained in this website.
    Fusion Media may be compensated by the advertisers that appear on the website, based on your interaction with the advertisements or advertisers.
    We're social. Connect with us:

    Facebook X (Twitter)
    • Home
    • About us
    • Contact
    • Disclaimer
    • Privacy Policy
    © 2025 Marketsnews.co.uk

    Type above and press Enter to search. Press Esc to cancel.