Close Menu
    What's Hot

    Bitcoin price sells off after Trump’s US-China tariff deal — Here is why

    Strategy Grows Bitcoin Holdings To $58.5 Billion With Latest $1.34 Billion Purchase

    Can US-China Trade Deal Push BTC to a New All-Time High?

    Facebook X (Twitter) Instagram
    MarketsNews.co.uk
    • Live Chart
    • Brokers
    • Scam Broker
    • Reviews
    • Tools
      • Lot Size Calculator
      • Margin Calculator
      • PIPS Calculator
      • Profit & loss calculator
    Facebook X (Twitter) Instagram
    Start Trading
    Trending Topics:
    • Markets
    • Stocks
    • Cryptocurrency
    • Forex
    • Scam Broker
    MarketsNews.co.uk
    • Markets
    • Stocks
    • Cryptocurrency
    • Forex
    • Scam Broker
    Cryptocurrency

    Mathematically Forecasting Peak Bitcoin Price For The Next Bull Cycle

    Anthony M. OrbisonBy Anthony M. OrbisonNovember 1, 2024No Comments4 Mins Read
    Share Facebook Twitter Pinterest Copy Link Telegram LinkedIn Tumblr Email
    Share
    Facebook Twitter LinkedIn Pinterest Email

    With years of historical data, we can observe the patterns from past bull cycles to become increasingly capable of making predictions about our current cycle. In this analysis, we take a deep dive into when the next Bitcoin peak may occur and at what price level.

    The Pi Cycle

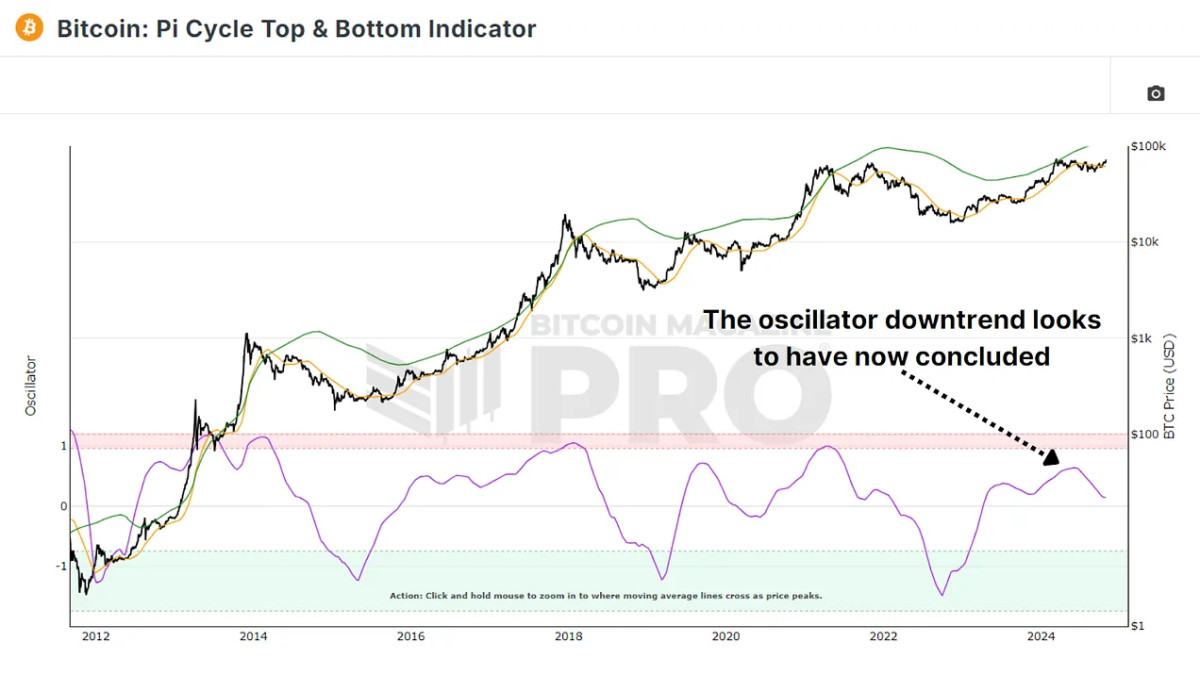
    The Pi Cycle Top Indicator is one of our most popular tools for analyzing Bitcoin’s cycles. This indicator monitors the 111-day and 350-day (multiplied by 2) moving averages, and when these two lines cross, it has historically been a reliable sign of Bitcoin reaching a cycle peak, typically within just a few days. After multiple months of these two levels drifting apart due to the sideways price action, we’ve just begun to see the 111-day trending back up again to begin closing the gap.

    Figure 1: Pi Cycle Top Indicator 111DMA has begun trending upward. View Live Chart 🔍

    We can measure the difference between the two averages to better define Bitcoin’s position within bull and bear cycles with the Pi Cycle Top & Bottom Indicator. This oscillator trending up again hints that Bitcoin’s next bull run may be just around the corner, with parallels to previous cycles seen in 2016 and 2020.

    Figure 2: Pi Cycle Top & Bottom Indicator ending its downtrend. View Live Chart 🔍

    Previous Bitcoin Cycles

    Historically, Bitcoin’s bull cycles exhibit similar phases: initial rapid growth, a cooling-off period, a second peak, and finally, a significant retracement followed by a new surge.

    2016 Cycle: This cycle saw a first peak, a dip, a second peak, and then a full-blown bull market. It’s very similar to the trend we’re currently seeing. Bitcoin’s price reached new highs after these two retracements.

    2020-2021 Cycle: The pattern was slightly less pronounced, but a similar trajectory was observed. Bitcoin’s price peaked twice, once during the initial surge and again at the peak of the bull run as BTC was reaching an all-time.

    Using the Bitcoin Magazine Pro API, we can simulate different growth scenarios based on past cycles. Since the Pi Cycle Top and Bottom oscillator recently turned upward we can overlay the rate of change in the oscillator from the previous cycles to see potential route this cycle.

    Figure 3: Oscillator and 111DMA projections based on historical rates of change.

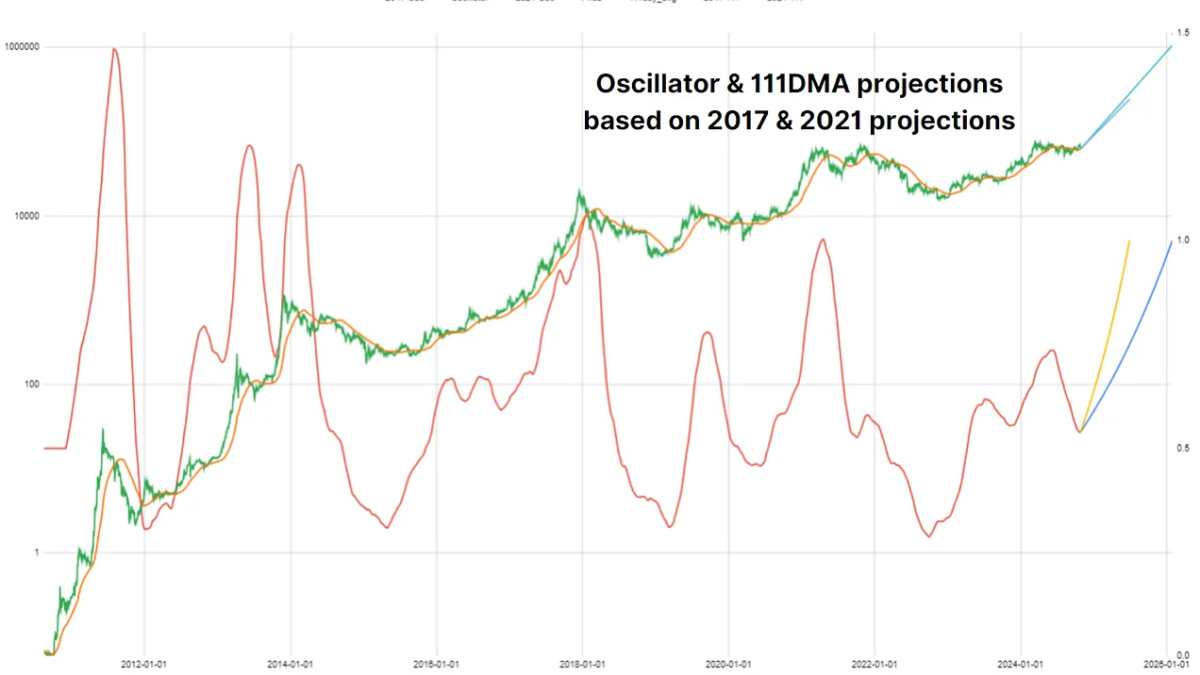
    If the 2021 cycle repeats, the 111-day and 350-day moving averages may cross around June 29, 2025, signaling a potential Bitcoin peak. If the 2017 cycle is mirrored, the moving averages might not cross until January 28, 2026, suggesting a later peak.

    Price Projections

    Using these dates, we can also attempt to estimate potential price levels. Historically, Bitcoin’s price exceeded the moving averages significantly at its peak. During the 2017 bull run, Bitcoin’s price was three times the value of these moving averages at the peak. However, as the market matures, we’ve seen diminishing returns in each cycle, meaning Bitcoin’s price might not increase as dramatically compared to its moving averages as it has historically.

    Figure 4: Potential targets for BTC this cycle based on previous cycle projections.

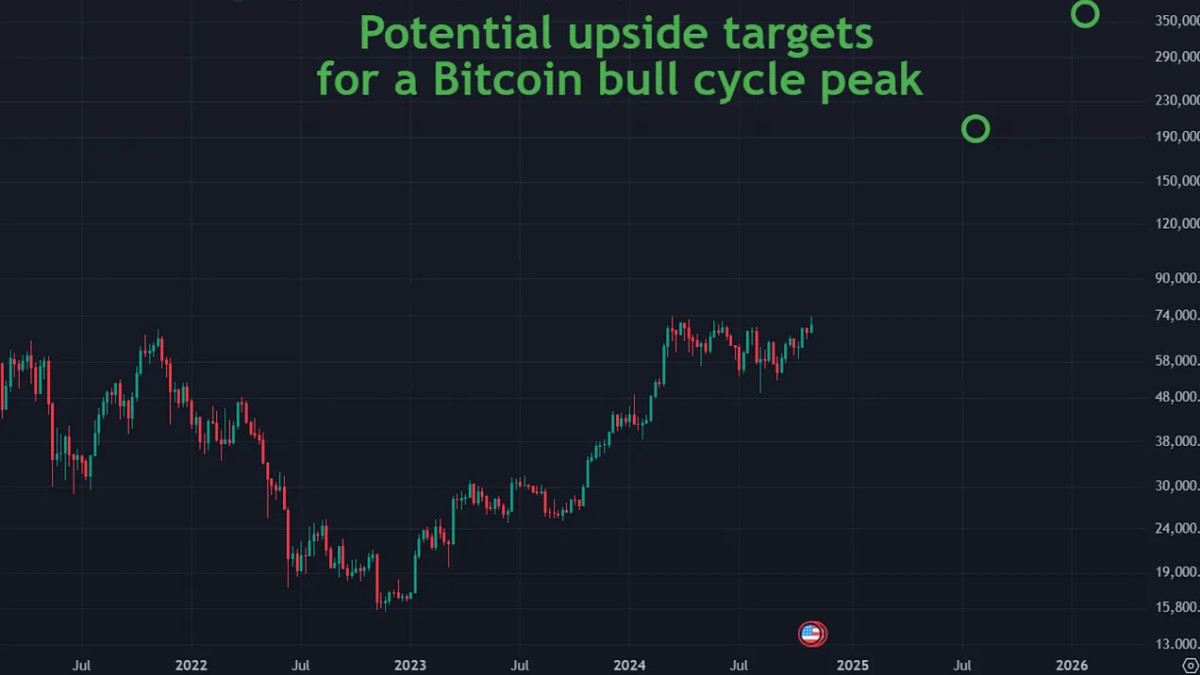
    If Bitcoin follows a pattern similar to the 2021 cycle, with an increase of about 40% above its moving averages, this would place Bitcoin’s peak at approximately $339,000. Assuming diminishing returns, Bitcoin’s price might only rise about 20% above the moving averages. In this case, the peak price would be closer to $200,000 by mid-2025.

    Similarly, if the 2017 extended cycle repeats with diminishing returns, Bitcoin could peak at $466,000 in early 2026, while a more moderate increase might result in a peak price of around $388,000. Although it’s unlikely Bitcoin will hit one million dollars in this cycle, these more tempered projections could still represent substantial gains.

    Conclusion

    While these projections use well-established data, they’re not guarantees. Every cycle has its unique dynamics influenced by economic conditions, investor sentiment, and regulatory changes. Diminishing returns and potentially even lengthening cycles are likely, reflecting the maturation of Bitcoin’s market.

    As Bitcoin’s bull cycle continues to develop, these predictive tools could provide increasingly accurate insights, particularly as the data evolves. However, analysis such as this provides potential outcomes to assist in your risk management and prepare for every outcome.

    For a more in-depth look into this topic, check out a recent YouTube video here: Mathematically Predicting The Next Bitcoin All Time High

    Source link

    Share. Facebook Twitter Pinterest LinkedIn Tumblr Email Copy Link
    Previous ArticleFCA warns Crispin Odey it will take action after his conduct ‘lacked integrity’
    Next Article U.S. regulators mull issues around siting data centers at power plants By Reuters
    Anthony M. Orbison
    • Website

    Related Posts

    Bitcoin price sells off after Trump’s US-China tariff deal — Here is why

    May 12, 2025

    Strategy Grows Bitcoin Holdings To $58.5 Billion With Latest $1.34 Billion Purchase

    May 12, 2025

    Can US-China Trade Deal Push BTC to a New All-Time High?

    May 12, 2025
    Leave A Reply Cancel Reply

    Amazon.com, Inc.
    $208.64
    $15.58
    8.07%
    Meta Platforms, Inc.
    $639.43
    $46.94
    7.92%
    S&P 500
    $5,844.19
    $184.28
    3.26%
    Alphabet Inc.
    $159.58
    $5.20
    3.37%
    EUR/USD
    $1.11
    $0.0163
    1.45%
    EUR/JPY
    $164.54
    $1.02
    0.62%
    USD/CAD
    $1.40
    $0.0036
    0.26%

    Risk Disclosure: Trading in financial instruments and/or cryptocurrencies involves high risks including the risk of losing some, or all, of your investment amount, and may not be suitable for all investors. Prices of cryptocurrencies are extremely volatile and may be affected by external factors such as financial, regulatory or political events. Trading on margin increases the financial risks.
    Before deciding to trade in financial instrument or cryptocurrencies you should be fully informed of the risks and costs associated with trading the financial markets, carefully consider your investment objectives, level of experience, and risk appetite, and seek professional advice where needed.
    Fusion Media would like to remind you that the data contained in this website is not necessarily real-time nor accurate. The data and prices on the website are not necessarily provided by any market or exchange, but may be provided by market makers, and so prices may not be accurate and may differ from the actual price at any given market, meaning prices are indicative and not appropriate for trading purposes. Fusion Media and any provider of the data contained in this website will not accept liability for any loss or damage as a result of your trading, or your reliance on the information contained within this website.
    It is prohibited to use, store, reproduce, display, modify, transmit or distribute the data contained in this website without the explicit prior written permission of Fusion Media and/or the data provider. All intellectual property rights are reserved by the providers and/or the exchange providing the data contained in this website.
    Fusion Media may be compensated by the advertisers that appear on the website, based on your interaction with the advertisements or advertisers.
    We're social. Connect with us:

    Facebook X (Twitter)
    • Home
    • About us
    • Contact
    • Disclaimer
    • Privacy Policy
    © 2025 Marketsnews.co.uk

    Type above and press Enter to search. Press Esc to cancel.