Close Menu
    What's Hot

    Ethereum price forms bullish setups as Wall Street demand gains steam

    VanEck, 21Shares, Canary press SEC to restore first-to-file ETF review order

    Ethereum Price Performance Could Hinge On This Binance Metric — Here’s Why

    Facebook X (Twitter) Instagram
    MarketsNews.co.uk
    • Live Chart
    • Brokers
    • Scam Broker
    • Reviews
    • Tools
      • Lot Size Calculator
      • Margin Calculator
      • PIPS Calculator
      • Profit & loss calculator
    Facebook X (Twitter) Instagram
    Start Trading
    Trending Topics:
    • Markets
    • Stocks
    • Cryptocurrency
    • Forex
    • Scam Broker
    MarketsNews.co.uk
    • Markets
    • Stocks
    • Cryptocurrency
    • Forex
    • Scam Broker
    Cryptocurrency

    Shiba Inu’s bullish trend meets order imbalance: A buy opportunity?

    Anthony M. OrbisonBy Anthony M. OrbisonDecember 13, 2024No Comments2 Mins Read
    Share Facebook Twitter Pinterest Copy Link Telegram LinkedIn Tumblr Email
    Share
    Facebook Twitter LinkedIn Pinterest Email
    • Shiba Inu has a bullish structure on the daily timeframe.
    • The order imbalance showed that a short-term price bounce was possible.

    Shiba Inu [SHIB] bulls struggled to break past the resistance form earlier this year. However, there was increased activity on-chain. The Shibarium TVL reached a new all-time high and the Layer-2 solution recently set a transaction milestone.

    Is SHIB set to consolidate?

    Shiba Inu 1-day TradingView

    Source: SHIB/USDT on TradingView

    On the daily timeframe, SHIB has a bullish market structure. The higher low at $0.0000266 from the 3rd of December did not see a daily session close below it. However, the MFI has fallen from near 80 in early December to 61 at press time.

    This showed that although momentum was bullish the capital inflow and buying pressure were losing strength. The fall below the $0.0000295 support level reinforced the bearish short-term bias.

    This level has been a significant resistance since April and was beaten in the second half of November. The recent losses have forced Shiba Inu bulls beneath this level again.

    From June to November, the $0.00002 resistance zone, highlighted by the red box, was also tested multiple times before a breakout. SHIB consolidated beneath this zone in October before rocketing higher.

    This is a possibility that Shiba Inu traders and investors have to be prepared for in the coming weeks. The $0.00003-$0.000037 region is a firm resistance from March. It could take a while to exhaust the sellers in this area.

    Orders imbalance suggests a potential price bounce
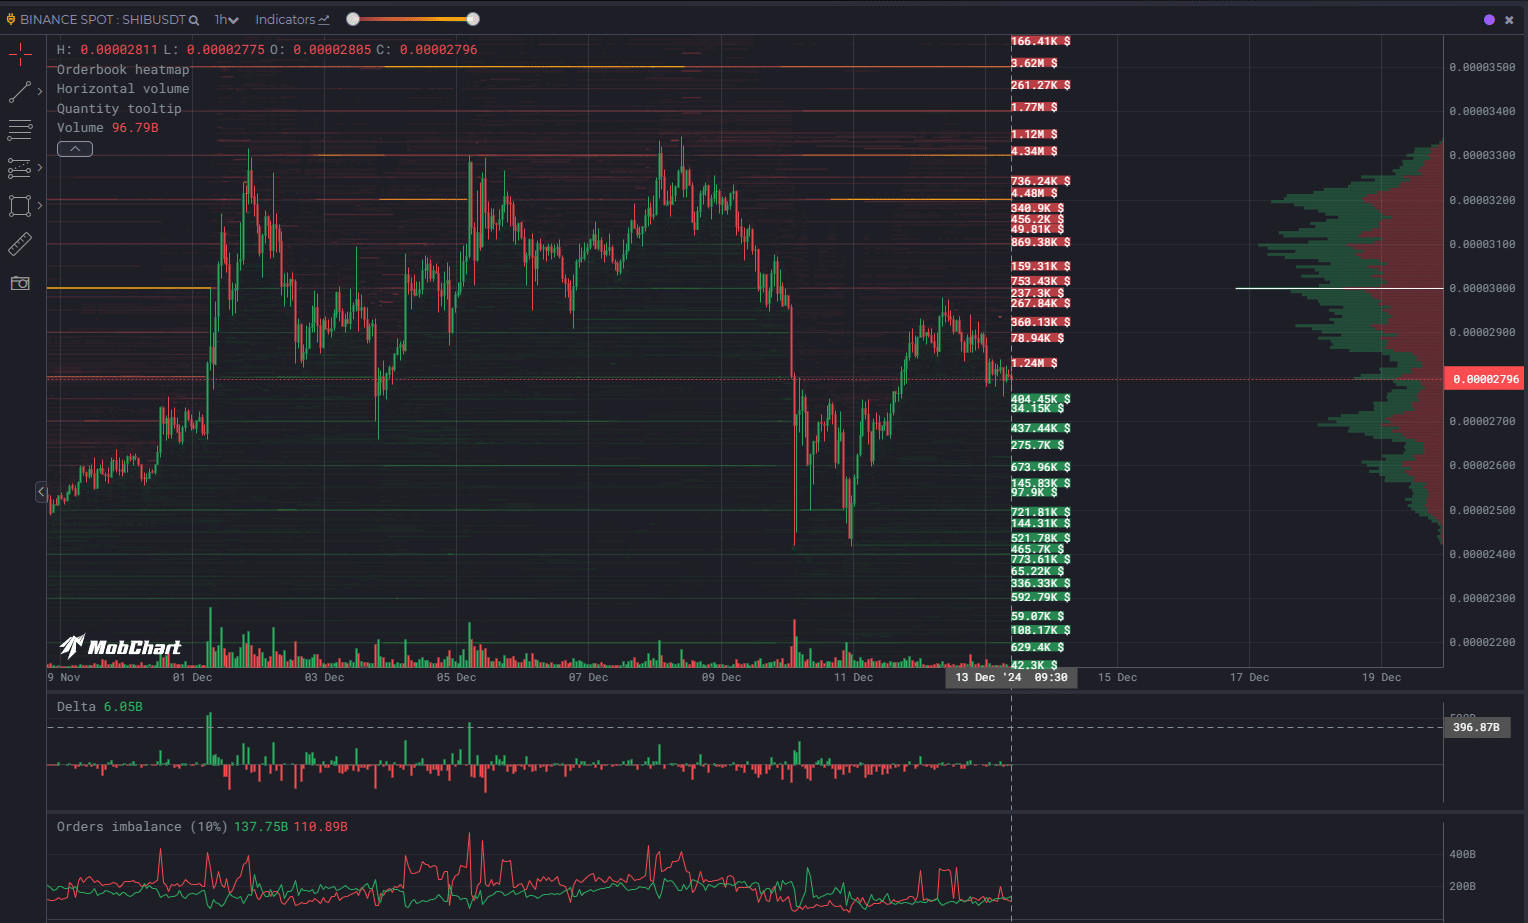
    Shiba Inu MobChartShiba Inu MobChart

    Source: MobChart

    There were large limit sell orders set at $0.000032 and extending to $0.000035. This meant that the price could face difficulty climbing beyond this resistance zone, which also lined up well with the March price action.


    Read Shiba Inu’s [SHIB] Price Prediction 2024-25


    The orders imbalance showed that sell orders were fewer within 10% of the price. This can be perceived as a short-term SHIB buying opportunity and could see a bounce toward the $0.00003 resistance zone.

    The delta showed that buy and sell pressure were finely balanced in recent hours.

    Disclaimer: The information presented does not constitute financial, investment, trading, or other types of advice and is solely the writer’s opinion

    Next: Cardano: Whales bet 80M ADA to reclaim $1.2 level -Will it work?

    Source link

    Share. Facebook Twitter Pinterest LinkedIn Tumblr Email Copy Link
    Previous ArticleThe U.S. already has a gambling epidemic—24 hour stock trading would only make it worse
    Next Article Flying will cost even more in 2025
    Anthony M. Orbison
    • Website

    Related Posts

    Ethereum price forms bullish setups as Wall Street demand gains steam

    June 9, 2025

    VanEck, 21Shares, Canary press SEC to restore first-to-file ETF review order

    June 9, 2025

    Ethereum Price Performance Could Hinge On This Binance Metric — Here’s Why

    June 9, 2025
    Leave A Reply Cancel Reply

    Amazon.com, Inc.
    $213.57
    $5.66
    2.72%
    Meta Platforms, Inc.
    $697.71
    $13.09
    1.91%
    S&P 500
    $6,000.36
    $61.06
    1.03%
    Alphabet Inc.
    $174.92
    $5.11
    3.01%
    EUR/USD
    $1.14
    $0.0027
    0.24%
    EUR/JPY
    $164.97
    $0.079
    0.05%
    USD/CAD
    $1.37
    $0.0006
    0.05%

    Risk Disclosure: Trading in financial instruments and/or cryptocurrencies involves high risks including the risk of losing some, or all, of your investment amount, and may not be suitable for all investors. Prices of cryptocurrencies are extremely volatile and may be affected by external factors such as financial, regulatory or political events. Trading on margin increases the financial risks.
    Before deciding to trade in financial instrument or cryptocurrencies you should be fully informed of the risks and costs associated with trading the financial markets, carefully consider your investment objectives, level of experience, and risk appetite, and seek professional advice where needed.
    Fusion Media would like to remind you that the data contained in this website is not necessarily real-time nor accurate. The data and prices on the website are not necessarily provided by any market or exchange, but may be provided by market makers, and so prices may not be accurate and may differ from the actual price at any given market, meaning prices are indicative and not appropriate for trading purposes. Fusion Media and any provider of the data contained in this website will not accept liability for any loss or damage as a result of your trading, or your reliance on the information contained within this website.
    It is prohibited to use, store, reproduce, display, modify, transmit or distribute the data contained in this website without the explicit prior written permission of Fusion Media and/or the data provider. All intellectual property rights are reserved by the providers and/or the exchange providing the data contained in this website.
    Fusion Media may be compensated by the advertisers that appear on the website, based on your interaction with the advertisements or advertisers.
    We're social. Connect with us:

    Facebook X (Twitter)
    • Home
    • About us
    • Contact
    • Disclaimer
    • Privacy Policy
    © 2025 Marketsnews.co.uk

    Type above and press Enter to search. Press Esc to cancel.