Close Menu
    What's Hot

    Bitcoin mining difficulty adjusts downward, but only slightly

    Ethereum bears lose ground, but ETH bulls may not be safe just yet!

    Bitcoin Holding $105K During War Is Bullish for Crypto

    Facebook X (Twitter) Instagram
    MarketsNews.co.uk
    • Live Chart
    • Brokers
    • Scam Broker
    • Reviews
    • Tools
      • Lot Size Calculator
      • Margin Calculator
      • PIPS Calculator
      • Profit & loss calculator
    Facebook X (Twitter) Instagram
    Start Trading
    Trending Topics:
    • Markets
    • Stocks
    • Cryptocurrency
    • Forex
    • Scam Broker
    MarketsNews.co.uk
    • Markets
    • Stocks
    • Cryptocurrency
    • Forex
    • Scam Broker
    Cryptocurrency

    Solana Could ‘Go Nuts’ As SOL Price Retests $160 Resistance

    Anthony M. OrbisonBy Anthony M. OrbisonSeptember 28, 2024No Comments3 Mins Read
    Share Facebook Twitter Pinterest Copy Link Telegram LinkedIn Tumblr Email
    Solana Could ‘Go Nuts As SOL Price Retests 160 Resistance
    Solana Could ‘Go Nuts As SOL Price Retests 160 Resistance
    Share
    Facebook Twitter LinkedIn Pinterest Email

    Este artículo también está disponible en español.

    Solana (SOL) broke above a key resistance level on Friday, fueling the bullish sentiment that reignited over a week ago. As a result, some analysts think the fifth-largest cryptocurrency by market capitalization could be about to see a massive bull run as “Uptober” approaches.

    Related Reading

    Solana Retests $160 Resistance

    Solana’s rally started last week following the market surge driven by the US Federal Reserve’s rate cuts. The jump pushed the cryptocurrency’s price above the $140 resistance level, successfully turning it into support.

    SOL had failed to break above this key level throughout the past month, consolidating between the $130-$139 price range. This performance alarmed many investors and market watchers, who considered the cryptocurrency was in danger of facing a massive correction.

    Since the bullish catalyst, Solana has seen a 23% surge, breaking above the $150 barrier this week. Some analysts asserted that reclaiming this mark would propel the price toward the next key resistance level.

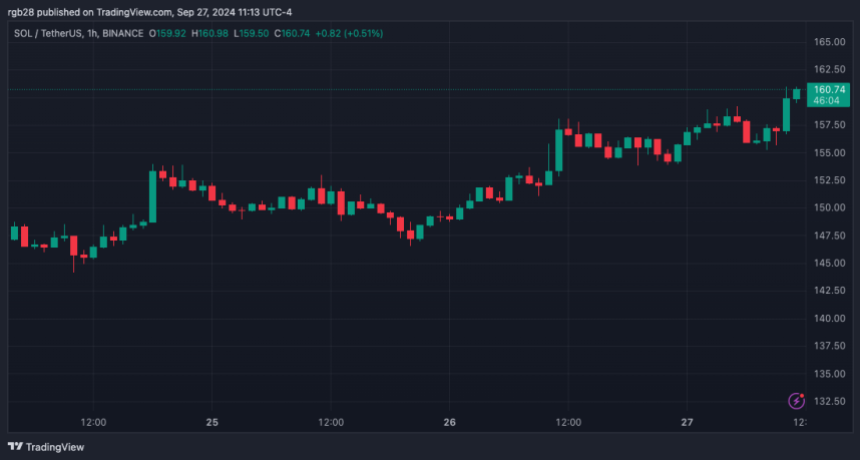
    On Friday, Solana broke above the crucial resistance level for the first time in a month, hitting $160 for the first time since late August. As of this writing, SOL reached a daily high of $160.68, momentarily holding the above the key level.

    This performance was seemingly fueled by the “bullish vibes” surrounding the early release from prison of Binance’s founder Changpeng Zhao (CZ). The expectation of his release further inspired a bullish market sentiment among investors, driving SOL’s 4% jump in an hour and Bitcoin’s price to $66,000.

    Is SOL Price About To “Go Insane”?

    Analyst Crypto Horn Harris noted Solana’s price action on the weekly chart, claiming it “looks nothing short of insane right now.” He underscored that SOL’ retested the Relative Strength Index (RSI) “properly” while doing a “perfect reset” of the 50-day Moving Average (MA).

    To the analyst, this performance hints that the cryptocurrency will challenge the cycle’s high above $200 and move to higher targets soon. WiseAnalyze claimed that SOL’s price “is still very low,” suggesting that investors still can “jump on that trend.”

    The trader set his target for the cycle’s final breakout at $400, “but it might grow higher.” However, he didn’t rule out the possibility of another rejection, with a pullback to the $108-$120 support zones.

    Similarly, Matthew Dixon also forecasted a retrace for Solana. The analyst believes a pullback is due, as multiple indicators suggest the correction. However, the “jury is out on the scope of the decline.”

    SOL’s price could be retraced from the previous support level. Source: Matthew Dixon on X

    Dixon stated that SOL’s price targets will depend on whether “the price action from the low is in the form ABC Or 123.” But “either way, the retrace is likely.”

    Related Reading

    Crypto analyst Byzantine General considers SOL’s chart to look “pretty crazy.” The trader highlighted that Solana appears to be printing an Adam and Eve (A&E) double-bottom pattern, with the confirmation line around the $160 price range.

    Based on this, Solana’s price “could go really nuts,” as it has the potential for a breakout toward the $200 resistance level if it successfully reclaims the key support level.
    Solana, SOL, SOLUSDT
    Solana’s performance in the three-day chart. Source: SOLUSDT on TradingView

    Featured Image from Unsplash.com, Chart from TradingView.com

    Source link

    Share. Facebook Twitter Pinterest LinkedIn Tumblr Email Copy Link
    Previous ArticleIsrael says it has killed Hizbollah chief Hassan Nasrallah
    Next Article Walmart is selling a 'unique and practical' $289 solid wood patio set for only $90
    Anthony M. Orbison
    • Website

    Related Posts

    Bitcoin mining difficulty adjusts downward, but only slightly

    June 15, 2025

    Ethereum bears lose ground, but ETH bulls may not be safe just yet!

    June 15, 2025

    Bitcoin Holding $105K During War Is Bullish for Crypto

    June 15, 2025
    Leave A Reply Cancel Reply

    Amazon.com, Inc.
    $212.10
    $1.14
    0.53%
    Meta Platforms, Inc.
    $682.87
    $10.49
    1.51%
    S&P 500
    $5,976.97
    $68.29
    1.13%
    Alphabet Inc.
    $175.88
    $1.09
    0.62%
    EUR/USD
    $1.15
    $0.0011
    0.09%
    EUR/JPY
    $166.76
    $0.359
    0.22%
    USD/CAD
    $1.36
    $0.0001
    0.01%

    Risk Disclosure: Trading in financial instruments and/or cryptocurrencies involves high risks including the risk of losing some, or all, of your investment amount, and may not be suitable for all investors. Prices of cryptocurrencies are extremely volatile and may be affected by external factors such as financial, regulatory or political events. Trading on margin increases the financial risks.
    Before deciding to trade in financial instrument or cryptocurrencies you should be fully informed of the risks and costs associated with trading the financial markets, carefully consider your investment objectives, level of experience, and risk appetite, and seek professional advice where needed.
    Fusion Media would like to remind you that the data contained in this website is not necessarily real-time nor accurate. The data and prices on the website are not necessarily provided by any market or exchange, but may be provided by market makers, and so prices may not be accurate and may differ from the actual price at any given market, meaning prices are indicative and not appropriate for trading purposes. Fusion Media and any provider of the data contained in this website will not accept liability for any loss or damage as a result of your trading, or your reliance on the information contained within this website.
    It is prohibited to use, store, reproduce, display, modify, transmit or distribute the data contained in this website without the explicit prior written permission of Fusion Media and/or the data provider. All intellectual property rights are reserved by the providers and/or the exchange providing the data contained in this website.
    Fusion Media may be compensated by the advertisers that appear on the website, based on your interaction with the advertisements or advertisers.
    We're social. Connect with us:

    Facebook X (Twitter)
    • Home
    • About us
    • Contact
    • Disclaimer
    • Privacy Policy
    © 2025 Marketsnews.co.uk

    Type above and press Enter to search. Press Esc to cancel.