Close Menu
    What's Hot

    Bitcoin Primed To Hit New All-Time High Once BTC Breaks Above This Resistance Level, According to Trader Michaël van de Poppe

    Alt ZK solutions can save Ethereum

    Bloomberg analysts revise altcoin ETF approval odds to ‘90% or higher’ as SEC requests amended filings

    Facebook X (Twitter) Instagram
    MarketsNews.co.uk
    • Live Chart
    • Brokers
    • Scam Broker
    • Reviews
    • Tools
      • Lot Size Calculator
      • Margin Calculator
      • PIPS Calculator
      • Profit & loss calculator
    Facebook X (Twitter) Instagram
    Start Trading
    Trending Topics:
    • Markets
    • Stocks
    • Cryptocurrency
    • Forex
    • Scam Broker
    MarketsNews.co.uk
    • Markets
    • Stocks
    • Cryptocurrency
    • Forex
    • Scam Broker
    Cryptocurrency

    Solana Cracks Below Key Structure – Head And Shoulders Breakdown Points To $106

    Anthony M. OrbisonBy Anthony M. OrbisonJune 22, 2025No Comments4 Mins Read
    Share Facebook Twitter Pinterest Copy Link Telegram LinkedIn Tumblr Email
    Share
    Facebook Twitter LinkedIn Pinterest Email

    Reason to trust

    Strict editorial policy that focuses on accuracy, relevance, and impartiality

    Created by industry experts and meticulously reviewed

    The highest standards in reporting and publishing

    Strict editorial policy that focuses on accuracy, relevance, and impartiality

    Morbi pretium leo et nisl aliquam mollis. Quisque arcu lorem, ultricies quis pellentesque nec, ullamcorper eu odio.

    Solana has broken down decisively, losing a critical support level following news that the United States launched an attack on Iranian nuclear facilities. The unexpected geopolitical development triggered widespread panic across financial markets, with altcoins taking the hardest hit. Solana, in particular, has seen significant selling pressure, dropping 20% from its May high of approximately $185 and now trading near $148.

    Related Reading

    This breakdown confirms investor concerns that SOL’s uptrend has weakened. Top analyst Carl Runefelt noted that Solana has completed a Head and Shoulders pattern—a bearish technical structure often signaling deeper downside. The price has broken below the neckline of this pattern, confirming the potential for continued declines in the short term.

    Adding to the bearish outlook is Solana’s inability to reclaim its prior support levels during brief bounces. With momentum indicators turning negative and broader market sentiment rattled, the likelihood of a swift recovery appears slim unless macro conditions stabilize.

    Solana Faces Deeper Correction As Bearish Pattern Unfolds

    Solana’s bullish momentum from late 2024 has all but faded, replaced by stagnation and sharp corrections as market conditions worsen. Now trading more than 50% below its all-time high, SOL continues to struggle under the weight of global macroeconomic uncertainty and rising geopolitical tensions. The US military strike on Iranian nuclear facilities has only added to the volatility, sending shockwaves through both traditional and crypto markets.

    While Solana was one of the strongest performers during the previous cycle, its price action has turned decisively bearish in recent weeks. Bulls have failed to maintain critical support levels, and the asset has now broken below its short-term trend structures. According to Runefelt, Solana has completed a Head and Shoulders pattern, a classic technical signal that often precedes a prolonged downtrend. The pattern’s neckline has been breached, and the projected bearish target now stands around $106.30—a level not seen since February.
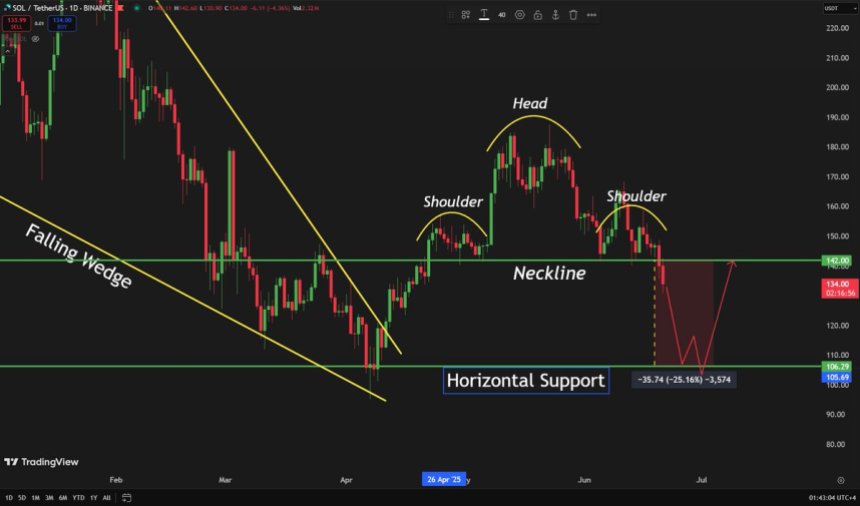
    Solana has broken out of this Head and Shoulders pattern | Source: Carl Runefelt on X
    Solana has broken out of this Head and Shoulders pattern | Source: Carl Runefelt on X

    The breakdown also reflects broader weakness in the altcoin market. Despite earlier hopes for an altseason, capital has rotated out of risk assets, favoring Bitcoin and stablecoins amid uncertainty. Solana’s inability to reclaim prior highs or establish higher lows points to a market in retreat. Momentum indicators continue to flash red, and unless bulls reclaim lost ground quickly, SOL could be facing an extended period of consolidation or further losses.

    Related Reading

    SOL Price Analysis: Breaking Below Key Support

    Solana is under pressure as it breaks below the critical 200-day simple moving average (SMA) around $149.54, a level that had previously acted as dynamic support. This breakdown signals growing bearish sentiment as price action confirms a loss of momentum following weeks of consolidation below the $155–$160 resistance zone. As of now, SOL is trading at approximately $135.99, down nearly 3% on the day and over 20% from its May highs.
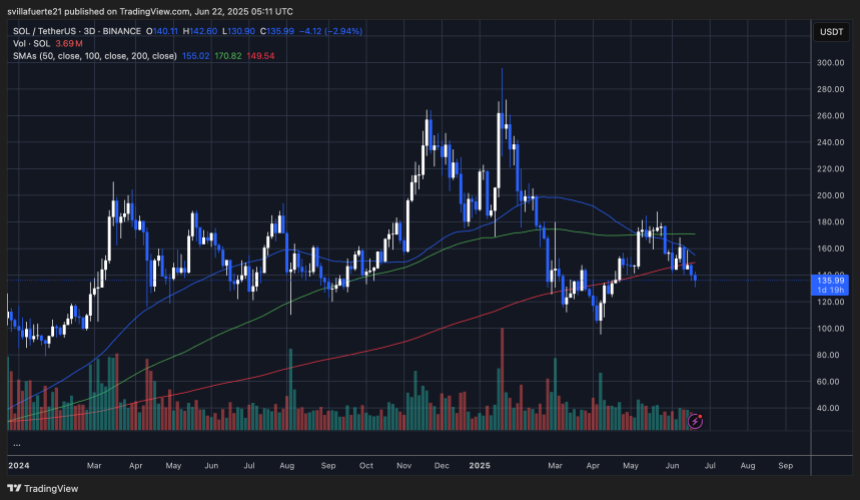
    SOL is struggling to hold support | SOLUSDT chart on TradingView
    SOL is struggling to hold support | Source: SOLUSDT chart on TradingView

    The chart shows a rejection near the 100-day SMA (green line), and the sustained move below both the 200-day and 50-day SMAs (blue line) points to a shifting structure, leaning heavily toward the downside. Volume remains elevated on red candles, confirming that the breakdown is supported by increasing sell pressure rather than a low-liquidity move.

    Related Reading

    If the current trend continues, Solana could revisit the $120–$125 range, which previously served as strong support in early Q1 2025. The broader context of macroeconomic volatility and geopolitical tension, particularly the recent U.S. attack on Iran, adds to investor unease across risk assets, including altcoins like Solana. A daily close back above $149 would be needed to neutralize the short-term bearish structure and shift sentiment. Until then, downside risks dominate.

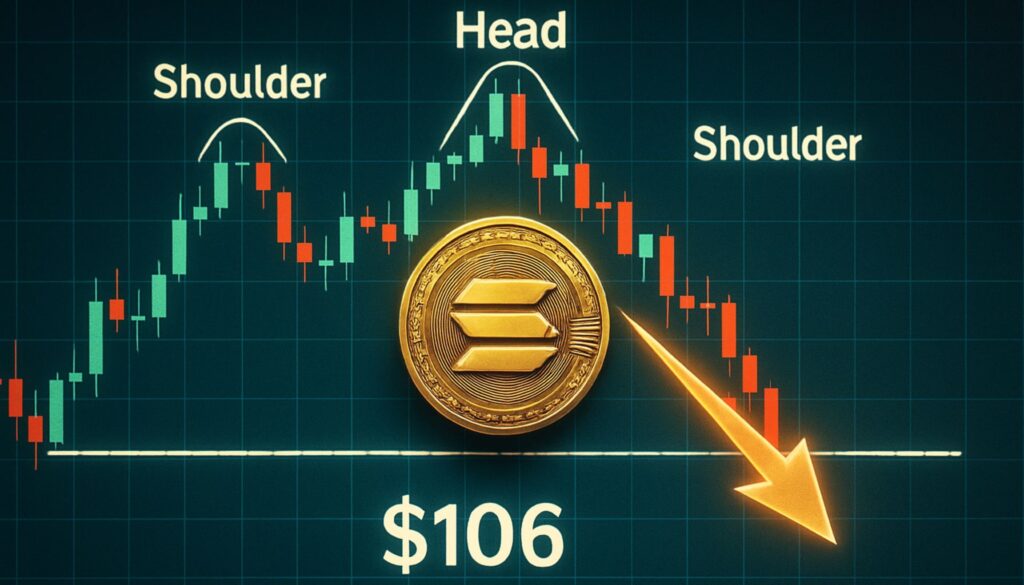
    Featured image from Dall-E, chart from TradingView
    Source link

    Share. Facebook Twitter Pinterest LinkedIn Tumblr Email Copy Link
    Previous ArticleSaylor’s Strategy Premium Not ‘Unreasonable’
    Next Article Ethereum Weekly Chart Nears Tower Top Formation As US Launches Attack On Iran – Details
    Anthony M. Orbison
    • Website

    Related Posts

    Bitcoin Primed To Hit New All-Time High Once BTC Breaks Above This Resistance Level, According to Trader Michaël van de Poppe

    June 22, 2025

    Alt ZK solutions can save Ethereum

    June 22, 2025

    Bloomberg analysts revise altcoin ETF approval odds to ‘90% or higher’ as SEC requests amended filings

    June 22, 2025
    Leave A Reply Cancel Reply

    Amazon.com, Inc.
    $209.69
    $2.83
    1.33%
    Meta Platforms, Inc.
    $682.35
    $13.42
    1.93%
    S&P 500
    $5,967.84
    $13.03
    0.22%
    Alphabet Inc.
    $167.73
    $6.25
    3.59%
    EUR/USD
    $1.15
    $0.0025
    0.22%
    EUR/JPY
    $168.33
    $1.21
    0.72%
    USD/CAD
    $1.37
    $0.0033
    0.24%

    Risk Disclosure: Trading in financial instruments and/or cryptocurrencies involves high risks including the risk of losing some, or all, of your investment amount, and may not be suitable for all investors. Prices of cryptocurrencies are extremely volatile and may be affected by external factors such as financial, regulatory or political events. Trading on margin increases the financial risks.
    Before deciding to trade in financial instrument or cryptocurrencies you should be fully informed of the risks and costs associated with trading the financial markets, carefully consider your investment objectives, level of experience, and risk appetite, and seek professional advice where needed.
    Fusion Media would like to remind you that the data contained in this website is not necessarily real-time nor accurate. The data and prices on the website are not necessarily provided by any market or exchange, but may be provided by market makers, and so prices may not be accurate and may differ from the actual price at any given market, meaning prices are indicative and not appropriate for trading purposes. Fusion Media and any provider of the data contained in this website will not accept liability for any loss or damage as a result of your trading, or your reliance on the information contained within this website.
    It is prohibited to use, store, reproduce, display, modify, transmit or distribute the data contained in this website without the explicit prior written permission of Fusion Media and/or the data provider. All intellectual property rights are reserved by the providers and/or the exchange providing the data contained in this website.
    Fusion Media may be compensated by the advertisers that appear on the website, based on your interaction with the advertisements or advertisers.
    We're social. Connect with us:

    Facebook X (Twitter)
    • Home
    • About us
    • Contact
    • Disclaimer
    • Privacy Policy
    © 2025 Marketsnews.co.uk

    Type above and press Enter to search. Press Esc to cancel.