Close Menu
    What's Hot

    My First Bitcoin Receives $1 Million Grant From Jack Dorsey To Expand Global Bitcoin Education

    Analysts Explain Why ETH is en Route to Overtaking Bitcoin

    Bitcoin shrugs off US CPI win as Binance CEO says BTC ‘leading pack’

    Facebook X (Twitter) Instagram
    MarketsNews.co.uk
    • Live Chart
    • Brokers
    • Scam Broker
    • Reviews
    • Tools
      • Lot Size Calculator
      • Margin Calculator
      • PIPS Calculator
      • Profit & loss calculator
    Facebook X (Twitter) Instagram
    Start Trading
    Trending Topics:
    • Markets
    • Stocks
    • Cryptocurrency
    • Forex
    • Scam Broker
    MarketsNews.co.uk
    • Markets
    • Stocks
    • Cryptocurrency
    • Forex
    • Scam Broker
    Cryptocurrency

    Solana Likely To Target $200 ‘If It Holds Current Support’ – What To Expect

    Anthony M. OrbisonBy Anthony M. OrbisonNovember 3, 2024No Comments4 Mins Read
    Share Facebook Twitter Pinterest Copy Link Telegram LinkedIn Tumblr Email
    Share
    Facebook Twitter LinkedIn Pinterest Email

    Este artículo también está disponible en español.

    Solana (SOL) is currently trading at a crucial demand level near $163, following a retrace from local highs around $183. This price is a critical support area that could determine the direction of SOL’s upcoming price action. Losing this level could signal a deeper correction, which would intensify selling pressure and potentially push SOL to retest lower support levels.

    However, top analyst Daan shared a technical analysis suggesting that if SOL can hold this “green zone” around $160, it could pave the way for a rebound. Daan notes that in the most optimistic scenario, SOL could hold this support and start a gradual climb, ultimately aiming to test the downtrend line that has kept it in check. This setup would keep SOL’s bullish structure intact, creating a potential entry point for investors eyeing a bounce.

    Related Reading

    With the broader crypto market showing volatility and Solana facing this pivotal level, the next few days will be crucial. Traders and investors are closely watching to see if this demand zone can support a reversal, potentially leading SOL back toward recent highs.

    Solana Holding Strong Despite Uncertainty

    Solana (SOL) has managed to hold above the key support level around $160, despite the recent market volatility and uncertainty. This level is crucial for SOL’s price structure, as it’s a strong demand zone that could act as a foundation for the next upward move. 

    Crypto analyst Daan recently shared his perspective on X, revealing that SOL’s “most bullish case” would be for it to hold this “green zone” around $160, allowing it to gradually grind back up toward the descending trendline that has capped recent gains.

    Solana testing crucial demand | Source: Daan on X

    In Daan’s view, the next attempt at this trendline could likely result in a successful breakout, with the potential to push SOL’s price above $200. He suggests that waiting for confirmation of this breakout could be a sound strategy for cautious investors, as there is still ample room for upside even after a confirmed reversal. His analysis highlights a confident outlook on SOL’s potential recovery, seeing this accumulation zone as a promising buying opportunity.

    However, Daan also acknowledges that there’s still a degree of downside risk. If SOL fails to hold above this $160 level, a deeper correction could follow, potentially driving SOL to test lower support levels. 

    Related Reading

    For now, the market will watch this support level closely as a critical indicator of SOL’s short-term trend. Holding above it would signal strength and open the door for a potential rally, while a breakdown could lead to a more extended bearish phase. As the overall market sentiment remains mixed, Solana’s next moves will be critical for traders and investors alike.

    SOL Price Action 

    Solana is currently trading at $163 after tagging the 4-hour 200 exponential moving average (EMA), a critical indicator of short-term strength. Holding above this EMA signals a bullish outlook for SOL, suggesting that buyers are stepping in to support the price at this level. If SOL can maintain momentum above the 200 EMA, it could build a foundation for a potential rally to new local highs, possibly challenging the recent peak around $183.

    SOL tagging the 4H 200 EMA
    SOL tagging the 4H 200 EMA | Source: SOLUSDT chart on TradingView

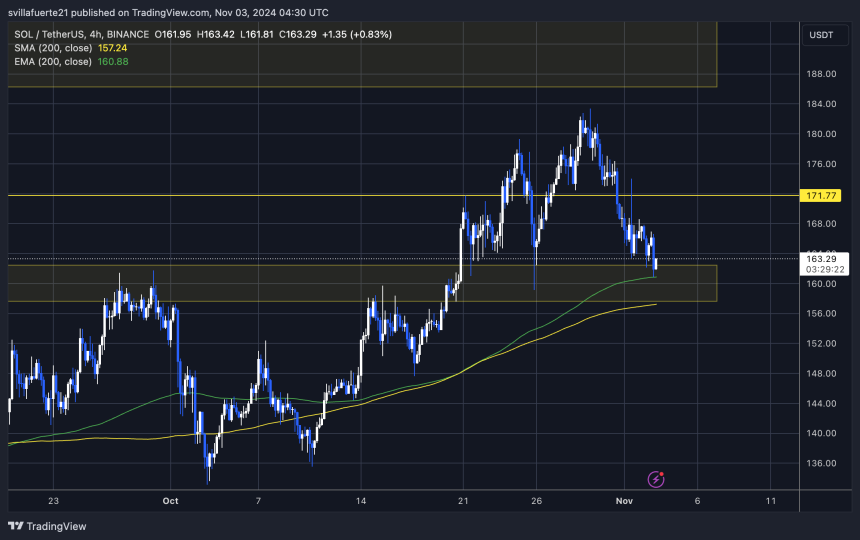
    However, the $160 level remains a crucial support area. Losing this support would likely trigger significant selling pressure, potentially driving SOL down to the $150 range, where further demand may emerge. This zone would be closely watched by investors looking for potential accumulation opportunities, as a dip could provide favorable entry points for long-term holders.

    Related Reading

    In contrast, a strong push above the current demand level would confirm renewed bullish momentum, paving the way for SOL to target and possibly surpass recent highs. As SOL hovers around this key technical zone, traders will be watching for any decisive movement that could signal the next direction, whether it be a continued uptrend or a retracement to lower demand levels.

    Featured image from Dall-E, chart from TradingView

    Source link

    Share. Facebook Twitter Pinterest LinkedIn Tumblr Email Copy Link
    Previous ArticleTrump and Harris make final appeals as US election goes down to the wire
    Next Article Celebrity Cruises' Captain Kate says goodbye, shares future plans
    Anthony M. Orbison
    • Website

    Related Posts

    My First Bitcoin Receives $1 Million Grant From Jack Dorsey To Expand Global Bitcoin Education

    May 13, 2025

    Analysts Explain Why ETH is en Route to Overtaking Bitcoin

    May 13, 2025

    Bitcoin shrugs off US CPI win as Binance CEO says BTC ‘leading pack’

    May 13, 2025
    Leave A Reply Cancel Reply

    Amazon.com, Inc.
    $211.37
    $2.73
    1.31%
    Meta Platforms, Inc.
    $656.03
    $16.60
    2.60%
    S&P 500
    $5,886.55
    $42.36
    0.72%
    Alphabet Inc.
    $160.89
    $1.31
    0.82%
    EUR/USD
    $1.12
    $0.0099
    0.90%
    EUR/JPY
    $164.92
    $0.404
    0.25%
    USD/CAD
    $1.39
    $0.0044
    0.31%

    Risk Disclosure: Trading in financial instruments and/or cryptocurrencies involves high risks including the risk of losing some, or all, of your investment amount, and may not be suitable for all investors. Prices of cryptocurrencies are extremely volatile and may be affected by external factors such as financial, regulatory or political events. Trading on margin increases the financial risks.
    Before deciding to trade in financial instrument or cryptocurrencies you should be fully informed of the risks and costs associated with trading the financial markets, carefully consider your investment objectives, level of experience, and risk appetite, and seek professional advice where needed.
    Fusion Media would like to remind you that the data contained in this website is not necessarily real-time nor accurate. The data and prices on the website are not necessarily provided by any market or exchange, but may be provided by market makers, and so prices may not be accurate and may differ from the actual price at any given market, meaning prices are indicative and not appropriate for trading purposes. Fusion Media and any provider of the data contained in this website will not accept liability for any loss or damage as a result of your trading, or your reliance on the information contained within this website.
    It is prohibited to use, store, reproduce, display, modify, transmit or distribute the data contained in this website without the explicit prior written permission of Fusion Media and/or the data provider. All intellectual property rights are reserved by the providers and/or the exchange providing the data contained in this website.
    Fusion Media may be compensated by the advertisers that appear on the website, based on your interaction with the advertisements or advertisers.
    We're social. Connect with us:

    Facebook X (Twitter)
    • Home
    • About us
    • Contact
    • Disclaimer
    • Privacy Policy
    © 2025 Marketsnews.co.uk

    Type above and press Enter to search. Press Esc to cancel.