Close Menu
    What's Hot

    ‘Dark stablecoins’ could emerge as regulations tighten

    Crypto Exchange Coinbase Adds Gold-Pegged Stablecoin PAXG to Listing Roadmap

    Shiba Inu pattern points to 190% surge as burn rate rises

    Facebook X (Twitter) Instagram
    MarketsNews.co.uk
    • Live Chart
    • Brokers
    • Scam Broker
    • Reviews
    • Tools
      • Lot Size Calculator
      • Margin Calculator
      • PIPS Calculator
      • Profit & loss calculator
    Facebook X (Twitter) Instagram
    Start Trading
    Trending Topics:
    • Markets
    • Stocks
    • Cryptocurrency
    • Forex
    • Scam Broker
    MarketsNews.co.uk
    • Markets
    • Stocks
    • Cryptocurrency
    • Forex
    • Scam Broker
    Cryptocurrency

    Solana Rallies Into Pivotal Zone – $180 Level Could Define Next Move

    Anthony M. OrbisonBy Anthony M. OrbisonMay 11, 2025No Comments4 Mins Read
    Share Facebook Twitter Pinterest Copy Link Telegram LinkedIn Tumblr Email
    Share
    Facebook Twitter LinkedIn Pinterest Email

    Reason to trust

    Strict editorial policy that focuses on accuracy, relevance, and impartiality

    Created by industry experts and meticulously reviewed

    The highest standards in reporting and publishing

    Strict editorial policy that focuses on accuracy, relevance, and impartiality

    Morbi pretium leo et nisl aliquam mollis. Quisque arcu lorem, ultricies quis pellentesque nec, ullamcorper eu odio.


    Este artículo también está disponible en español.

    Solana is gaining momentum once again, with price action pushing above the $175 level for the first time in weeks. The move comes as crypto markets roar back to life, fueled by Bitcoin’s push above $100K and Ethereum’s explosive rally past $2,500. Solana has surged more than 20% in the past week alone, signaling strong demand and a renewed bullish outlook from traders and investors alike.

    Related Reading

    Top analyst Big Cheds shared a technical analysis revealing that Solana is now making a strong advance into a key spot—the underside of the daily 200 moving average (DMA). The asset is also approaching a lower high around the $180 mark, which previously acted as resistance during the last failed breakout attempt. Cheds notes that reclaiming this zone would be a significant win for bulls, potentially triggering a sharp continuation toward new highs.

    Market sentiment is turning optimistic across the board, and Solana’s technical setup reflects that shift. As price approaches the 200DMA, all eyes are on whether SOL can hold this momentum and break through key levels to join the broader market rally. The coming days will be crucial for confirming a full trend reversal.

    Solana Approaches Pivotal Level As Bulls Eye Breakout

    Solana is showing renewed strength after a clean breakout above the $160 resistance zone, a level that had capped price action for several weeks. The surge has brought SOL into a critical region that could act as a pivot point—either igniting a fresh bullish rally or marking a temporary top before a retrace.

    As global tensions between the US and China and broader macroeconomic uncertainties linger, the crypto market remains exposed to sudden sentiment shifts. However, recent price action in Solana, along with Bitcoin and Ethereum, suggests that investors are increasingly optimistic about a continued market recovery.

    Solana’s current structure reflects that optimism. The asset is now testing the underside of its daily 200 moving average, a level often viewed by traders as a trend-defining indicator. A successful push above this moving average would add further confidence to the bullish thesis. At the same time, Solana is approaching a lower high near the $180 zone, where the price was previously rejected in March. Cheds points to this convergence as a crucial area: a breakout here could mark the beginning of a larger reversal pattern.

    SOL testing the underside of DMA 200 | Source: Cheds on X
    SOL testing the underside of DMA 200 | Source: Cheds on X

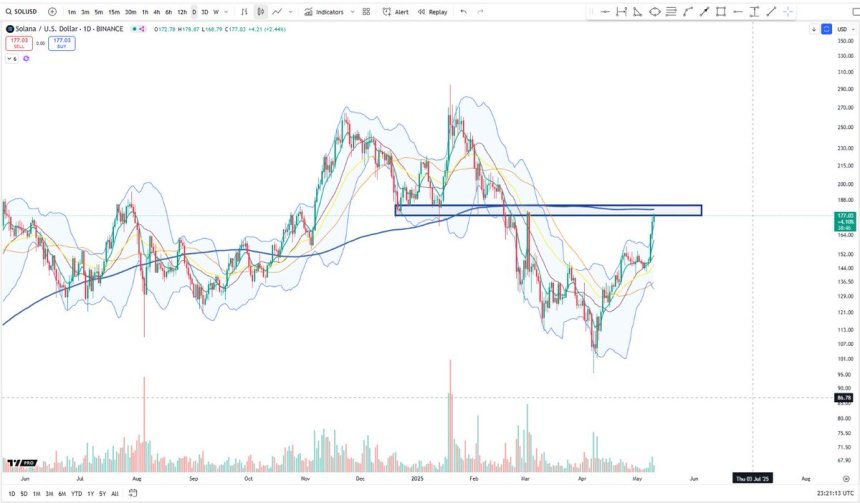
    Still, risks remain. A rejection at the $180 level could reinforce resistance and trigger a pullback toward the $160 support, especially if macro conditions worsen or profit-taking sets in. For now, however, bulls appear to be in control, and the technical landscape supports a potential continuation—if momentum holds.

    Related Reading

    Technical Levels: Price Action Shows Strength

    Solana (SOL) is exhibiting strong momentum as it trades at $176.41, advancing toward a crucial resistance area around the $180 level. The daily chart shows that SOL has surged rapidly from April lows, breaking above both the 200-day EMA ($161.67) and approaching the 200-day SMA ($181.10), a key area that could determine the next major trend.

    SOL testing the 200-day MA | Source: SOLUSDT chart on TradingView
    SOL testing the 200-day MA | Source: SOLUSDT chart on TradingView

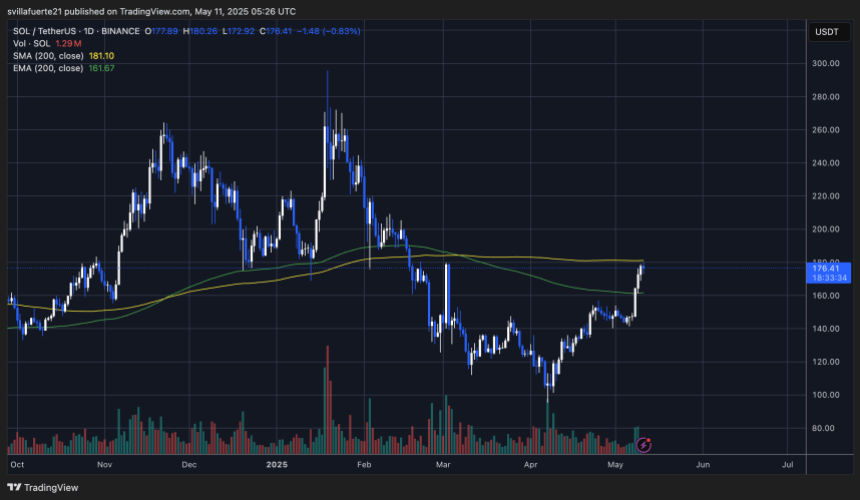
    This zone acted as support and resistance multiple times in the past, particularly during Q4 2024 and early 2025. Now, as price returns to this range, it becomes a potential pivot point. If bulls can sustain pressure and close above $181.10 with volume confirmation, it may trigger a continuation toward $200 and possibly retest February highs above $260. However, failure to break above this range could prompt a rejection and consolidation below the 200 SMA.

    Related Reading

    Volume has picked up significantly over the last few days, indicating rising interest and participation from traders. This is a constructive sign as Solana attempts to reclaim higher ground. For now, the trend remains bullish, but eyes are on the $180–$185 resistance zone to confirm whether SOL has the strength to continue its breakout or faces a short-term pullback.

    Featured image from Dall-E, chart from TradingView

    Source link

    Share. Facebook Twitter Pinterest LinkedIn Tumblr Email Copy Link
    Previous ArticleEl Salvador stacks 7 Bitcoin in last week, despite IMF deal
    Next Article Ethereum Holds Above $1900 Realized Price Signalling Long-Term Bullish Confidence
    Anthony M. Orbison
    • Website

    Related Posts

    ‘Dark stablecoins’ could emerge as regulations tighten

    May 12, 2025

    Crypto Exchange Coinbase Adds Gold-Pegged Stablecoin PAXG to Listing Roadmap

    May 12, 2025

    Shiba Inu pattern points to 190% surge as burn rate rises

    May 12, 2025
    Leave A Reply Cancel Reply

    Amazon.com, Inc.
    $193.06
    $0.98
    0.51%
    Meta Platforms, Inc.
    $592.49
    $5.52
    0.92%
    S&P 500
    $5,659.91
    $4.03
    0.07%
    Alphabet Inc.
    $154.38
    $1.37
    0.88%
    EUR/USD
    $1.12
    $0.0019
    0.17%
    EUR/JPY
    $163.85
    $0.328
    0.20%
    USD/CAD
    $1.39
    $0.0013
    0.09%

    Risk Disclosure: Trading in financial instruments and/or cryptocurrencies involves high risks including the risk of losing some, or all, of your investment amount, and may not be suitable for all investors. Prices of cryptocurrencies are extremely volatile and may be affected by external factors such as financial, regulatory or political events. Trading on margin increases the financial risks.
    Before deciding to trade in financial instrument or cryptocurrencies you should be fully informed of the risks and costs associated with trading the financial markets, carefully consider your investment objectives, level of experience, and risk appetite, and seek professional advice where needed.
    Fusion Media would like to remind you that the data contained in this website is not necessarily real-time nor accurate. The data and prices on the website are not necessarily provided by any market or exchange, but may be provided by market makers, and so prices may not be accurate and may differ from the actual price at any given market, meaning prices are indicative and not appropriate for trading purposes. Fusion Media and any provider of the data contained in this website will not accept liability for any loss or damage as a result of your trading, or your reliance on the information contained within this website.
    It is prohibited to use, store, reproduce, display, modify, transmit or distribute the data contained in this website without the explicit prior written permission of Fusion Media and/or the data provider. All intellectual property rights are reserved by the providers and/or the exchange providing the data contained in this website.
    Fusion Media may be compensated by the advertisers that appear on the website, based on your interaction with the advertisements or advertisers.
    We're social. Connect with us:

    Facebook X (Twitter)
    • Home
    • About us
    • Contact
    • Disclaimer
    • Privacy Policy
    © 2025 Marketsnews.co.uk

    Type above and press Enter to search. Press Esc to cancel.