Close Menu
    What's Hot

    US Fed surprise rate cut may lead to Bitcoin surge: Analyst

    Bitcoin Reserve, Stablecoin Regulation are Main Drivers

    Ross Ulbricht’s Bitcoin donor tied to dark market Alphabay

    Facebook X (Twitter) Instagram
    MarketsNews.co.uk
    • Live Chart
    • Brokers
    • Scam Broker
    • Reviews
    • Tools
      • Lot Size Calculator
      • Margin Calculator
      • PIPS Calculator
      • Profit & loss calculator
    Facebook X (Twitter) Instagram
    Start Trading
    Trending Topics:
    • Markets
    • Stocks
    • Cryptocurrency
    • Forex
    • Scam Broker
    MarketsNews.co.uk
    • Markets
    • Stocks
    • Cryptocurrency
    • Forex
    • Scam Broker
    Cryptocurrency

    Stacks (STX) – Here’s where you can find the next buy opportunity after 26% fall

    Anthony M. OrbisonBy Anthony M. OrbisonDecember 21, 2024No Comments3 Mins Read
    Share Facebook Twitter Pinterest Copy Link Telegram LinkedIn Tumblr Email
    Share
    Facebook Twitter LinkedIn Pinterest Email

    contributor

    Posted: December 21, 2024

    • Stacks tested the $1.75 support amid a 26% weekly drop
    • Ascending channel pointed to bullish potential, with the resistance at $2.40 and target at $10

    Stacks (STX) was trading at $1.71, at the time of writing, following a 11.73% decline over the last 24 hours and a 26.06% drop in just 7 days. With a circulating supply of 1.5 billion STX, the cryptocurrency had a market capitalization of $2.57 billion. 

    Trading volume in the last 24 hours stood at $439 million, indicating substantial activity during this price drop.

    The recent downturn in STX‘s price seemed to be in line with a broader market decline. This downturn pushed the token towards its critical support level within a long-term ascending channel.

    Ascending channel indicates long-term bullish trend

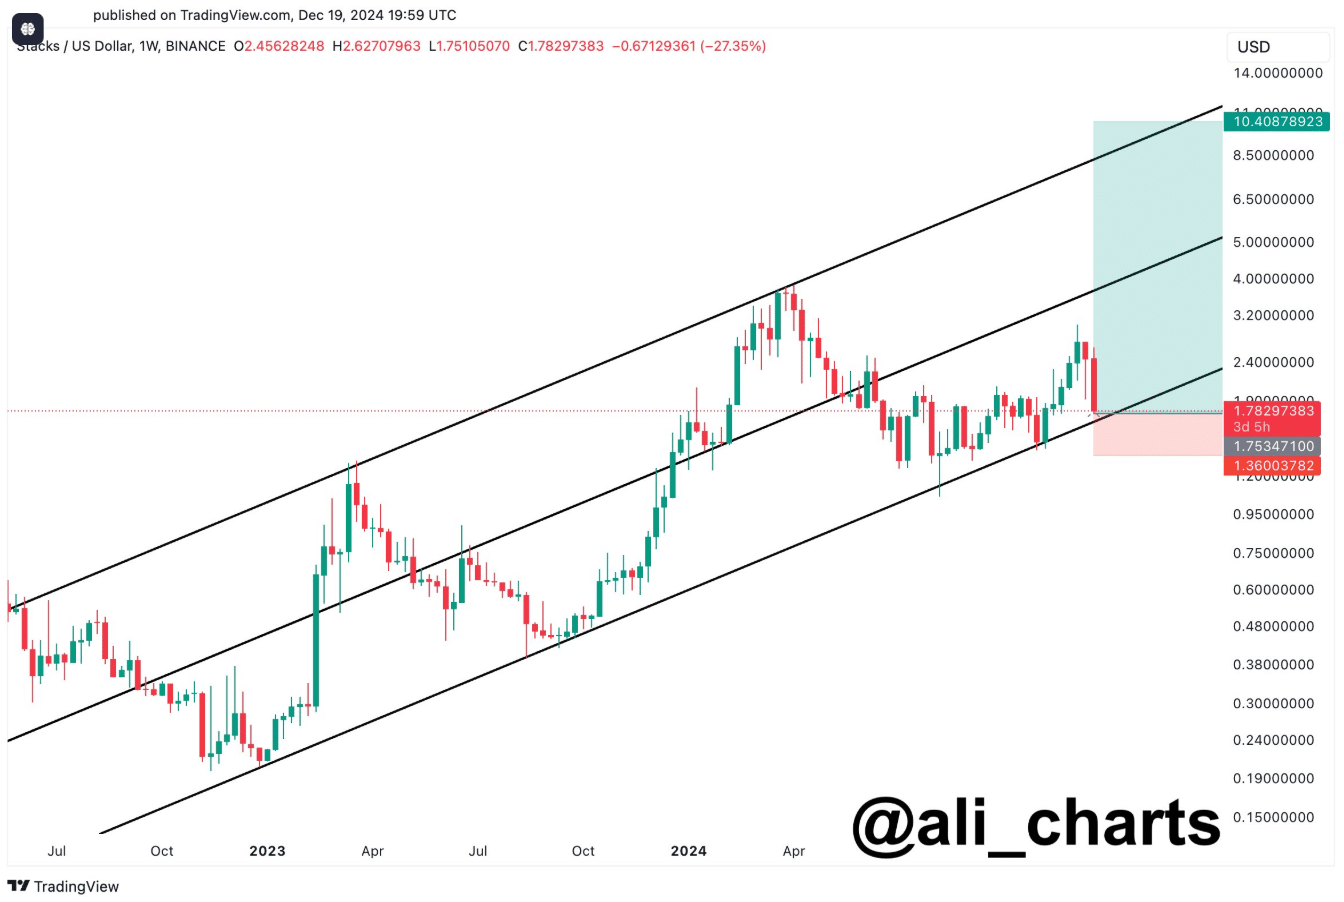
    According to AMBCrypto’s analysis, Stacks seemed to be trading within a defined ascending channel – A sign of a broader bullish trend despite recent declines. At press time, the price was approaching the lower boundary of this channel, between $1.70 and $1.80 – A zone that has consistently acted as strong support.

    The upper boundary of the channel pointed to a potential target near $10, suggesting room for future price recovery if the support holds. 

    In fact, popular analyst Ali Martinez described this phase as a possible buying opportunity, emphasizing the importance of the  levels for long-term investors.

    Source: X

    Recent correction and key levels

    Stacks pulled back sharply from its mid-channel resistance near $4.50, falling by 27.35% during this correction. While this decline has pushed the price towards its support, such pullbacks are common in long-term uptrends and may provide accumulation opportunities.

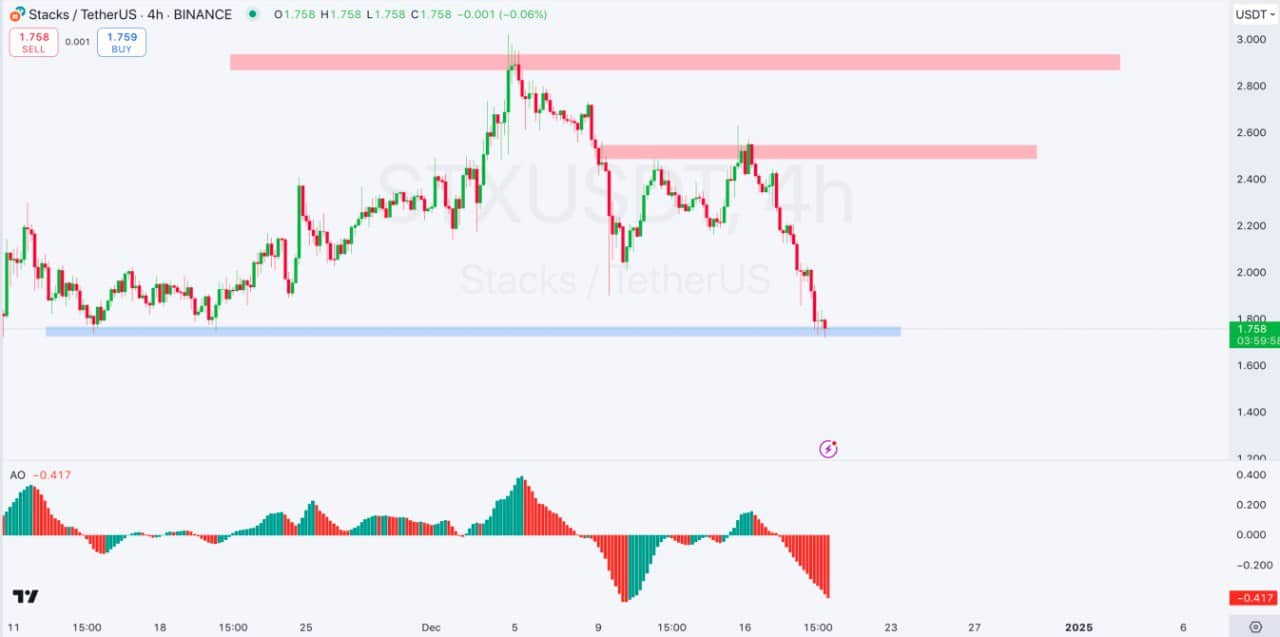
    The support at $1.75 – $1.78 will be critical in determining the next move for STX. If this level holds, it could lead to a rebound, with initial resistance targets at $2.40 – $2.50 and stronger resistance near $2.80 – $3.00. 

    However, a breakdown below $1.75 could trigger further declines, with the next major support levels at $1.50 and $1.40.

    Source: TradingView

    Momentum indicators signal mixed trends

    The Awesome Oscillator (AO), at press time, displayed red bars – A sign of bearish momentum. However, a declining histogram indicated that selling pressure may be easing. For a bullish reversal, green bars on the AO would be needed, along with a breakout above lower-high resistance levels.

    Traders should closely monitor the $1.75 zone for signs of a rebound or further breakdown. A sustained move above this level could push the price towards the $2.00 – $2.40 range in the near term.

    Outlook and key metrics to watch

    With STX trading near its support, investors are watching key levels to determine the next trend. The immediate support stands at $1.75, with major resistance zones at $2.40 and $2.80. If the lower boundary of the ascending channel is breached, downside targets of $1.50 or lower may come into play.

    This correction, while steep, fits within a larger pattern of growth for Stacks, suggesting potential for recovery if support levels hold. 

    Previous: PEPE’s road to recovery – A 10% hike, but will that be enough?
    Next: Bitcoin sees $671.9M ETF sell-offs after BTC crashes below $94K

    Source link

    Share. Facebook Twitter Pinterest LinkedIn Tumblr Email Copy Link
    Previous ArticleCiti stays Buy on Micron despite worse than expected guidance
    Next Article ​​Nordstrom Rack is selling an $80 sheet set for just $36, and shoppers say it's 'so soft'
    Anthony M. Orbison
    • Website

    Related Posts

    US Fed surprise rate cut may lead to Bitcoin surge: Analyst

    June 6, 2025

    Bitcoin Reserve, Stablecoin Regulation are Main Drivers

    June 6, 2025

    Ross Ulbricht’s Bitcoin donor tied to dark market Alphabay

    June 6, 2025
    Leave A Reply Cancel Reply

    Amazon.com, Inc.
    $207.91
    $0.68
    0.33%
    Meta Platforms, Inc.
    $684.62
    $3.33
    0.48%
    S&P 500
    $5,939.30
    $31.51
    0.53%
    Alphabet Inc.
    $169.81
    $0.42
    0.25%
    EUR/USD
    $1.14
    $0.0017
    0.15%
    EUR/JPY
    $164.58
    $0.299
    0.18%
    USD/CAD
    $1.37
    $0.0005
    0.04%

    Risk Disclosure: Trading in financial instruments and/or cryptocurrencies involves high risks including the risk of losing some, or all, of your investment amount, and may not be suitable for all investors. Prices of cryptocurrencies are extremely volatile and may be affected by external factors such as financial, regulatory or political events. Trading on margin increases the financial risks.
    Before deciding to trade in financial instrument or cryptocurrencies you should be fully informed of the risks and costs associated with trading the financial markets, carefully consider your investment objectives, level of experience, and risk appetite, and seek professional advice where needed.
    Fusion Media would like to remind you that the data contained in this website is not necessarily real-time nor accurate. The data and prices on the website are not necessarily provided by any market or exchange, but may be provided by market makers, and so prices may not be accurate and may differ from the actual price at any given market, meaning prices are indicative and not appropriate for trading purposes. Fusion Media and any provider of the data contained in this website will not accept liability for any loss or damage as a result of your trading, or your reliance on the information contained within this website.
    It is prohibited to use, store, reproduce, display, modify, transmit or distribute the data contained in this website without the explicit prior written permission of Fusion Media and/or the data provider. All intellectual property rights are reserved by the providers and/or the exchange providing the data contained in this website.
    Fusion Media may be compensated by the advertisers that appear on the website, based on your interaction with the advertisements or advertisers.
    We're social. Connect with us:

    Facebook X (Twitter)
    • Home
    • About us
    • Contact
    • Disclaimer
    • Privacy Policy
    © 2025 Marketsnews.co.uk

    Type above and press Enter to search. Press Esc to cancel.