Close Menu
    What's Hot

    Japan’s ‘MicroStrategy’ Metaplanet Posts Record Quarter Numbers, Now Owns Over $700 Million Bitcoin

    Susquehanna International Discloses $291M Bitcoin ETF Holdings

    BTC, ETH, XRP, BNB, SOL, DOGE, ADA, SUI, LINK, AVAX

    Facebook X (Twitter) Instagram
    MarketsNews.co.uk
    • Live Chart
    • Brokers
    • Scam Broker
    • Reviews
    • Tools
      • Lot Size Calculator
      • Margin Calculator
      • PIPS Calculator
      • Profit & loss calculator
    Facebook X (Twitter) Instagram
    Start Trading
    Trending Topics:
    • Markets
    • Stocks
    • Cryptocurrency
    • Forex
    • Scam Broker
    MarketsNews.co.uk
    • Markets
    • Stocks
    • Cryptocurrency
    • Forex
    • Scam Broker
    Cryptocurrency

    SUI Price Stability At $3.5 Signals Room For More Growth, $4 Mark Imminent?

    Anthony M. OrbisonBy Anthony M. OrbisonNovember 19, 2024No Comments3 Mins Read
    Share Facebook Twitter Pinterest Copy Link Telegram LinkedIn Tumblr Email
    Share
    Facebook Twitter LinkedIn Pinterest Email

    Despite market fluctuations, SUI has demonstrated remarkable stability, holding steady above the critical $3.5 support level. This steady performance reflects underlying bullish momentum, as buyers continue to defend this key zone, boosting confidence in the asset’s upward potential. With strong support intact, SUI appears well-positioned to target higher resistance levels, sparking optimism for further gains.

    This analysis aims to explore SUI’s ability to stay above the $3.5 level and assess its implications for future price movements. By examining key technical indicators and resistance zones, this piece seeks to provide insights into whether SUI can sustain its bullish strength or if market pressures could trigger a shift in its trajectory.

    What SUI Stability Above $3.5 Means For Bulls

    SUI is showcasing renewed bullish strength as it maintains a firm position above the critical $3.5 support level. This stability highlights growing buying interest and market confidence, paving the way for a possible move toward the $4 mark. Its ability to hold above this key level and the 4-hour Simple Moving Average (SMA) reinforces the asset’s upward momentum, and positions SUI for further gains if positive sentiment persists.

    An analysis of the 4-hour Relative Strength Index (RSI) analysis shows a rebound from 51%, rising toward and above the 60% level, indicating a renewed optimistic outlook. If the RSI continues to rise above 60%, it would confirm the positive trend, boosting the potential for more price growth.

    Additionally, SUI shows significant upward movement on the daily chart, marked by the formation of a bullish candlestick as it moves toward the $4 mark. Trading above the crucial 100-day SMA reinforces the positive trend, indicating sustained strength. As SUI continues to climb, it bolsters market confidence, setting the stage for growth. With upside pressure brewing, the next key target to watch out for is the $4 resistance level, which could determine whether the bullish move extends.

    SUI

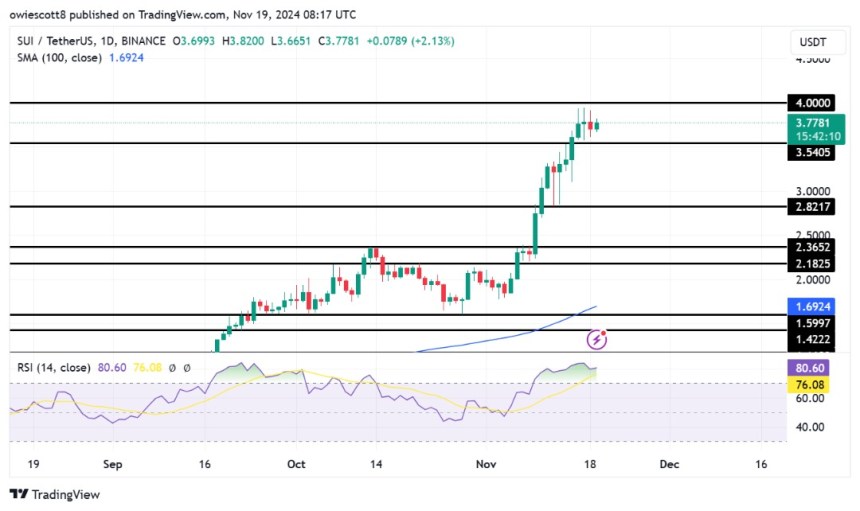
    The daily chart’s RSI has increased to 80%, signaling strong positive sentiment with sustained buying pressure. While the asset remains in an overbought territory, it shows no signs of weakening. If the momentum continues, further price gains are possible, though one should be cautious, as prolonged overbought conditions could lead to a correction if buying pressure decreases.

    Potential Scenarios: Upside Targets And Risks To Watch

    SUI’s current stability above the $3.5 support level indicates potential for continued upside. Should buying pressure persist, the next key target lies at $4, where bullish interest could be triggered, leading to new price highs.

    However, if resistance at $4 proves challenging to break through, consolidation or a minor decline may occur, possibly causing the price to retreat toward the $3.5 support level. A break below this level could result in additional losses, with the next key support target being around $2.8, followed by other support areas below.

    SUI

    Source link

    Share. Facebook Twitter Pinterest LinkedIn Tumblr Email Copy Link
    Previous ArticleStocks fall as Ukraine war escalation unsettles markets
    Next Article Walmart is selling a 'handy' $320 car battery jump starter for just $88 during its early Black Friday sale
    Anthony M. Orbison
    • Website

    Related Posts

    Japan’s ‘MicroStrategy’ Metaplanet Posts Record Quarter Numbers, Now Owns Over $700 Million Bitcoin

    May 14, 2025

    Susquehanna International Discloses $291M Bitcoin ETF Holdings

    May 14, 2025

    BTC, ETH, XRP, BNB, SOL, DOGE, ADA, SUI, LINK, AVAX

    May 14, 2025
    Leave A Reply Cancel Reply

    Amazon.com, Inc.
    $210.25
    $1.12
    0.53%
    Meta Platforms, Inc.
    $659.36
    $3.33
    0.51%
    S&P 500
    $5,892.58
    $6.03
    0.10%
    Alphabet Inc.
    $166.81
    $5.92
    3.68%
    EUR/USD
    $1.12
    $0.0005
    0.04%
    EUR/JPY
    $163.94
    $1.02
    0.62%
    USD/CAD
    $1.40
    $0.0037
    0.27%

    Risk Disclosure: Trading in financial instruments and/or cryptocurrencies involves high risks including the risk of losing some, or all, of your investment amount, and may not be suitable for all investors. Prices of cryptocurrencies are extremely volatile and may be affected by external factors such as financial, regulatory or political events. Trading on margin increases the financial risks.
    Before deciding to trade in financial instrument or cryptocurrencies you should be fully informed of the risks and costs associated with trading the financial markets, carefully consider your investment objectives, level of experience, and risk appetite, and seek professional advice where needed.
    Fusion Media would like to remind you that the data contained in this website is not necessarily real-time nor accurate. The data and prices on the website are not necessarily provided by any market or exchange, but may be provided by market makers, and so prices may not be accurate and may differ from the actual price at any given market, meaning prices are indicative and not appropriate for trading purposes. Fusion Media and any provider of the data contained in this website will not accept liability for any loss or damage as a result of your trading, or your reliance on the information contained within this website.
    It is prohibited to use, store, reproduce, display, modify, transmit or distribute the data contained in this website without the explicit prior written permission of Fusion Media and/or the data provider. All intellectual property rights are reserved by the providers and/or the exchange providing the data contained in this website.
    Fusion Media may be compensated by the advertisers that appear on the website, based on your interaction with the advertisements or advertisers.
    We're social. Connect with us:

    Facebook X (Twitter)
    • Home
    • About us
    • Contact
    • Disclaimer
    • Privacy Policy
    © 2025 Marketsnews.co.uk

    Type above and press Enter to search. Press Esc to cancel.