Close Menu
    What's Hot

    Major crypto hacks fell 40% in May, says PeckShield

    France Charges 25 Over Crypto Kidnapping Spree in Paris

    dogwifhat [WIF] sees 24% weekly loss – Is $0.709 the last support before…

    Facebook X (Twitter) Instagram
    MarketsNews.co.uk
    • Live Chart
    • Brokers
    • Scam Broker
    • Reviews
    • Tools
      • Lot Size Calculator
      • Margin Calculator
      • PIPS Calculator
      • Profit & loss calculator
    Facebook X (Twitter) Instagram
    Start Trading
    Trending Topics:
    • Markets
    • Stocks
    • Cryptocurrency
    • Forex
    • Scam Broker
    MarketsNews.co.uk
    • Markets
    • Stocks
    • Cryptocurrency
    • Forex
    • Scam Broker
    Cryptocurrency

    The Graph gains 28% in a week: Will bull’s dominance continue?

    Anthony M. OrbisonBy Anthony M. OrbisonSeptember 24, 2024No Comments2 Mins Read
    Share Facebook Twitter Pinterest Copy Link Telegram LinkedIn Tumblr Email
    The Graph gains 28 in a week Will bulls dominance.webp
    The Graph gains 28 in a week Will bulls dominance.webp
    Share
    Facebook Twitter LinkedIn Pinterest Email
    Avatar

    Journalist

    Posted: September 24, 2024

    • GRT has a bearish market structure on the daily, despite strong short-term gains.
    • The moving averages signaled that the long-term downtrend was still in play.

    The Graph [GRT] token has performed well since last Monday. Like the rest of the crypto market, the token has registered double-digit price gains. It remains to be seen whether the bulls can defend these recent gains.

    While the short-term bias was bullish, the long-term trend has been bearish. The performance since June has been in favor of the sellers, and the bulls might not have the strength yet to force a sizeable recovery.

    The Graph is on the verge of breaking August highs

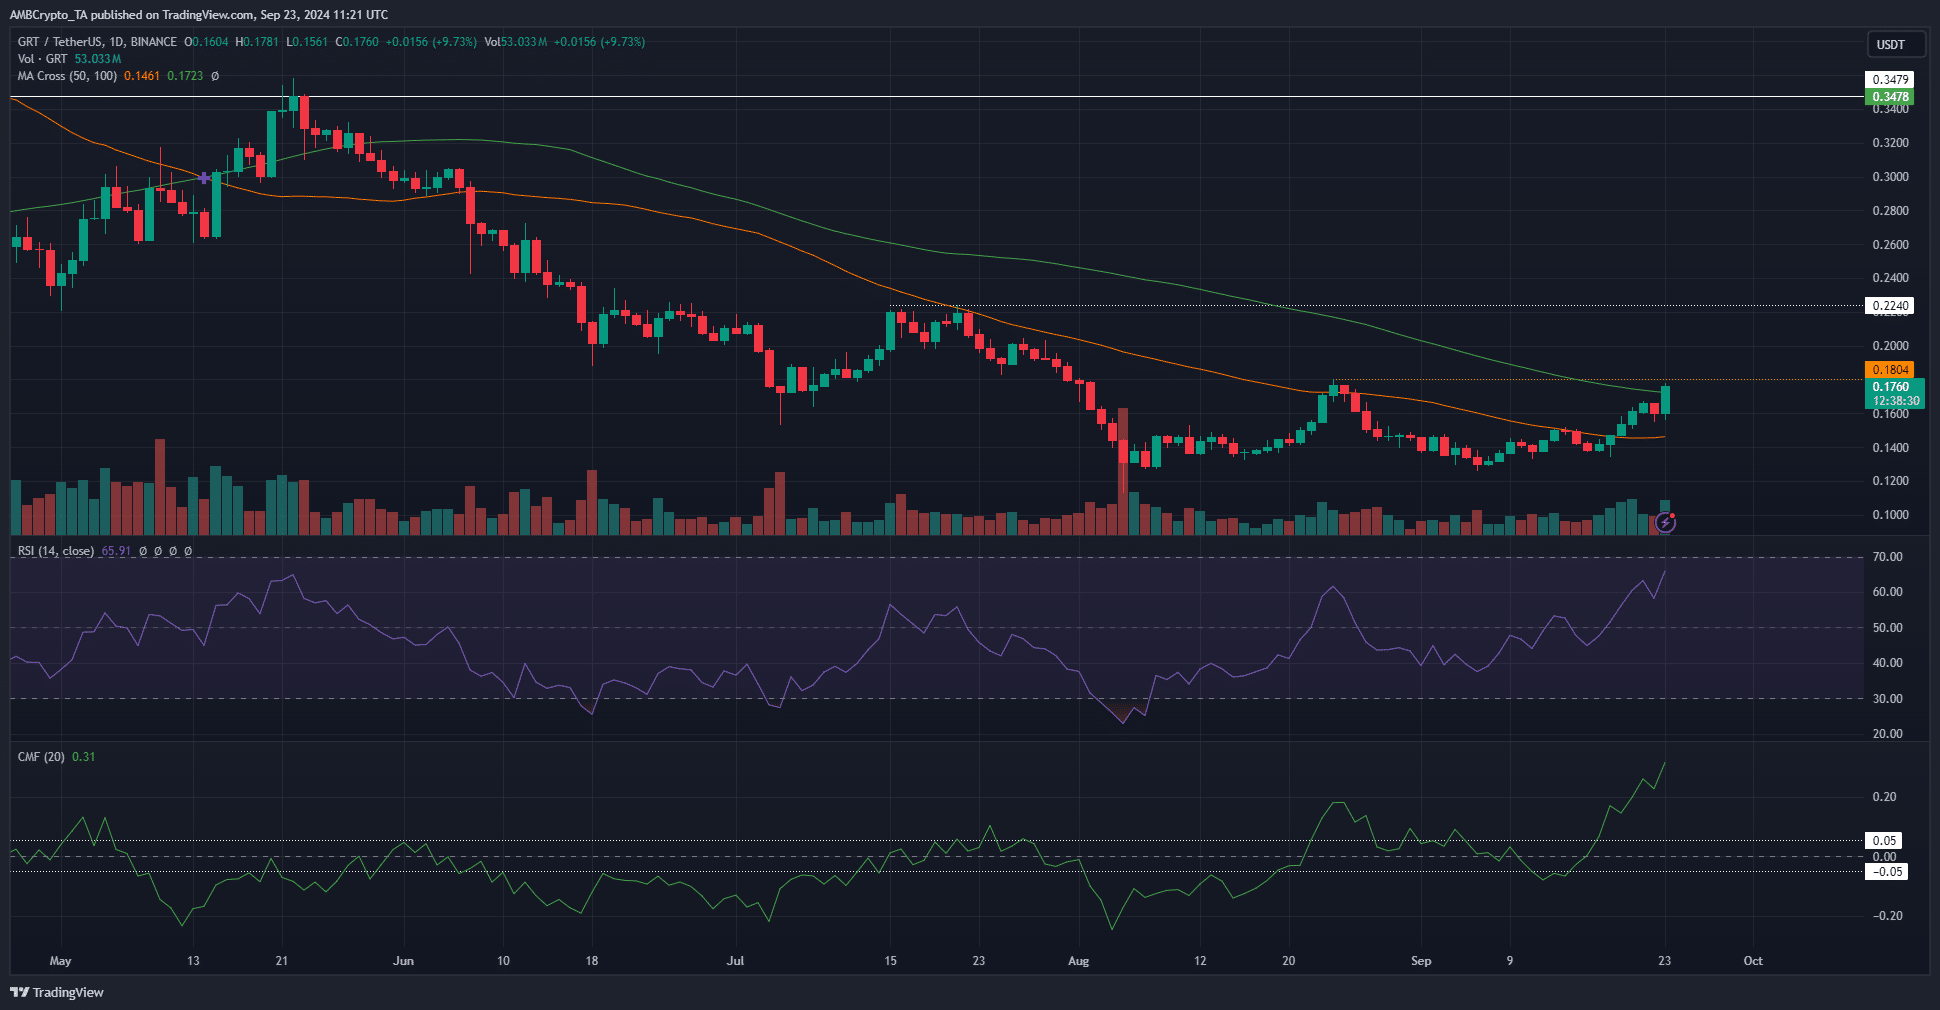
    The Graph 1-day ChartThe Graph 1-day Chart

    Source: GRT/USDT on TradingView

    The Graph token was performing well over the past week and was charging toward the local resistance level at $0.18. The RSI was at 65 and has been rising since the second week of September.

    This showed bullish momentum has been building up. The CMF also recovered from -0.05 to reach +0.31, a reading not seen on the indicator since February.

    This indicated heavy capital flow into the GRT market, which could bolster bullish efforts to break the $0.18 resistance.

    The simple moving averages captured the essence of the downtrend. The faster 50DMA was still below the 100 DMA, meaning that the recent move higher needs to be sustained for a longer period to break the downtrend.

    Lack of selling during the minor price dip was encouraging
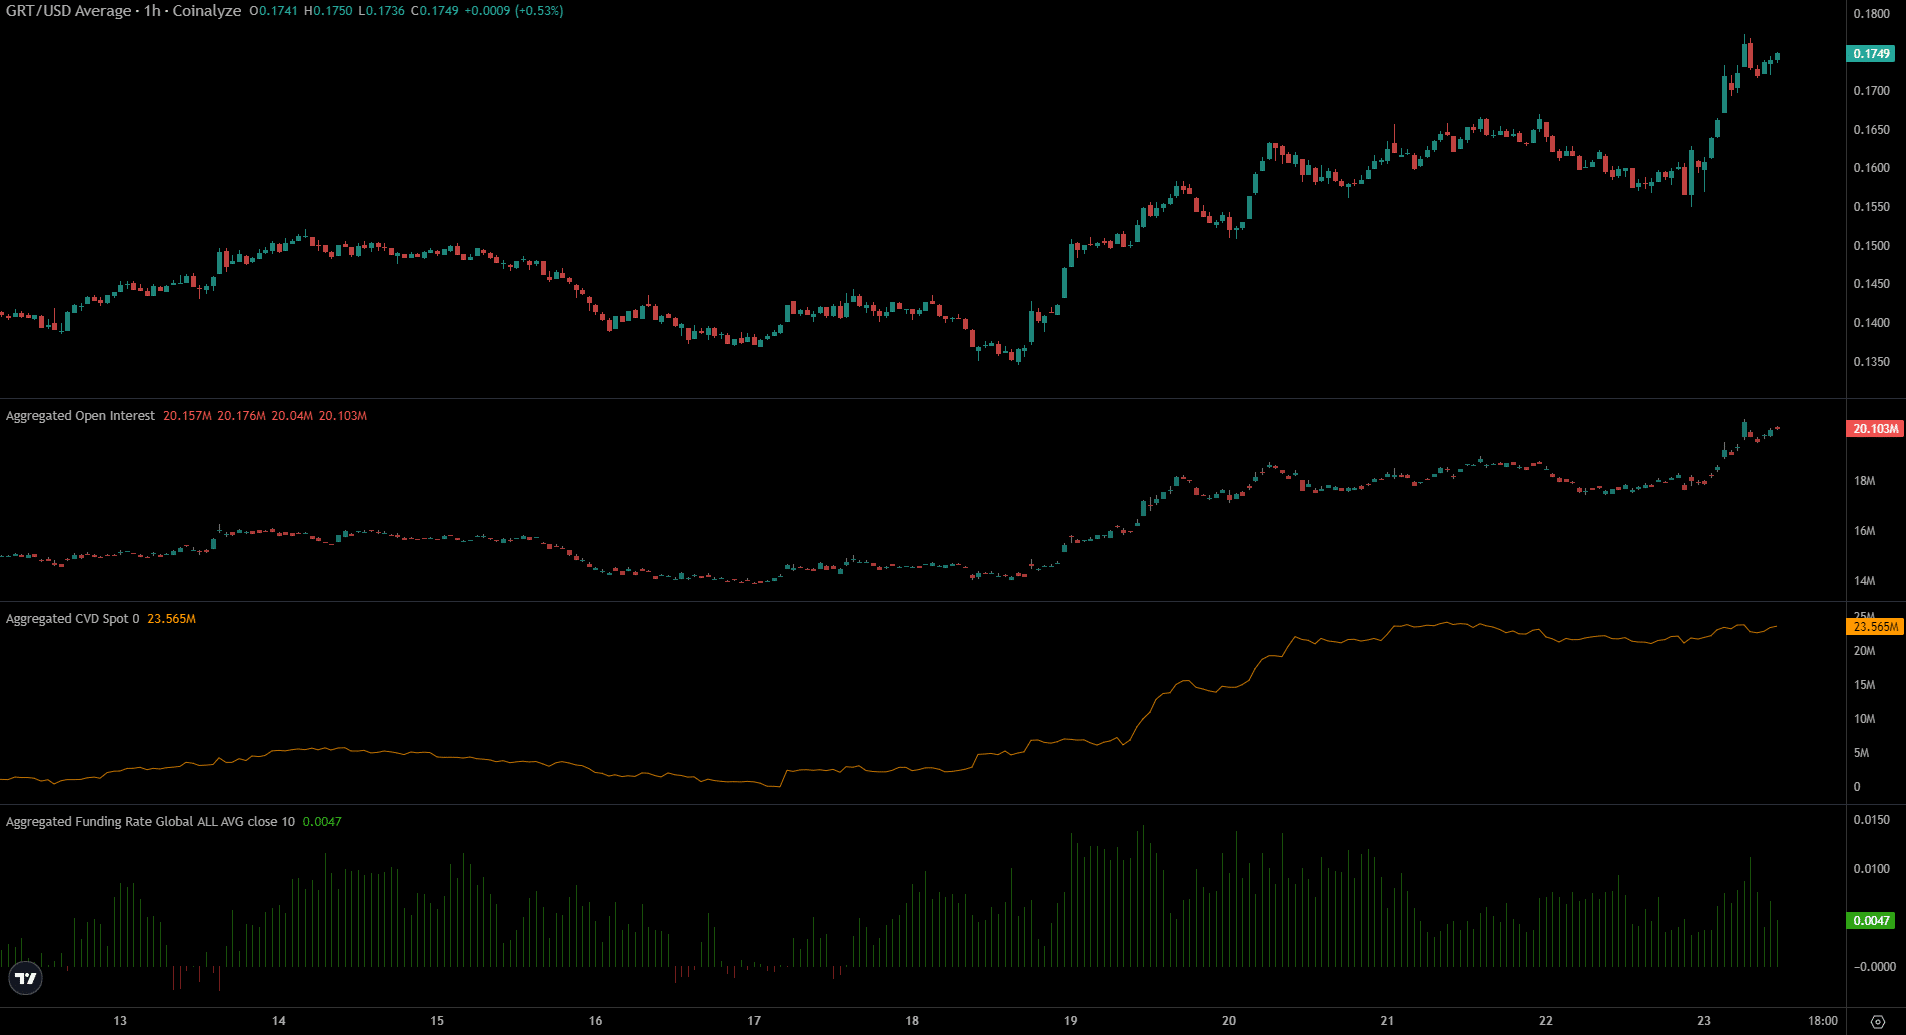
    The Graph CoinalyzeThe Graph Coinalyze

    Source: Coinalyze

    Over the past week, both the price and the Open Interest have surged higher to show bullish sentiment. Speculators are eager to go long on GRT. This was a market-wide phenomenon after the Bitcoin resurgence.


    Is your portfolio green? Check out The Graph Profit Calculator


    Other assets have seen their spot CVD remain in a sideways trend, meaning the rally was not supported by spot demand.

    The Graph token saw high demand in recent days and little selling pressure. The funding rate was also positive.

    Disclaimer: The information presented does not constitute financial, investment, trading, or other types of advice and is solely the writer’s opinion
    Next: Will BNB finally break the $600 barrier as CZ returns this week?

    Source link

    Share. Facebook Twitter Pinterest LinkedIn Tumblr Email Copy Link
    Previous ArticleUnlock the Secrets of Forex Trading: A Beginner’s Journey
    Next Article Chinese stocks hold bullish outlook, Gavekal Research says By Investing.com
    Anthony M. Orbison
    • Website

    Related Posts

    Major crypto hacks fell 40% in May, says PeckShield

    June 1, 2025

    France Charges 25 Over Crypto Kidnapping Spree in Paris

    June 1, 2025

    dogwifhat [WIF] sees 24% weekly loss – Is $0.709 the last support before…

    June 1, 2025
    Leave A Reply Cancel Reply

    Amazon.com, Inc.
    $205.01
    $0.69
    0.34%
    Meta Platforms, Inc.
    $647.49
    $2.44
    0.38%
    S&P 500
    $5,911.69
    $0.48
    0.01%
    Alphabet Inc.
    $172.85
    $0.11
    0.06%
    EUR/USD
    $1.14
    $0.0019
    0.17%
    EUR/JPY
    $163.47
    $0.413
    0.25%
    USD/CAD
    $1.37
    $0.0066
    0.48%

    Risk Disclosure: Trading in financial instruments and/or cryptocurrencies involves high risks including the risk of losing some, or all, of your investment amount, and may not be suitable for all investors. Prices of cryptocurrencies are extremely volatile and may be affected by external factors such as financial, regulatory or political events. Trading on margin increases the financial risks.
    Before deciding to trade in financial instrument or cryptocurrencies you should be fully informed of the risks and costs associated with trading the financial markets, carefully consider your investment objectives, level of experience, and risk appetite, and seek professional advice where needed.
    Fusion Media would like to remind you that the data contained in this website is not necessarily real-time nor accurate. The data and prices on the website are not necessarily provided by any market or exchange, but may be provided by market makers, and so prices may not be accurate and may differ from the actual price at any given market, meaning prices are indicative and not appropriate for trading purposes. Fusion Media and any provider of the data contained in this website will not accept liability for any loss or damage as a result of your trading, or your reliance on the information contained within this website.
    It is prohibited to use, store, reproduce, display, modify, transmit or distribute the data contained in this website without the explicit prior written permission of Fusion Media and/or the data provider. All intellectual property rights are reserved by the providers and/or the exchange providing the data contained in this website.
    Fusion Media may be compensated by the advertisers that appear on the website, based on your interaction with the advertisements or advertisers.
    We're social. Connect with us:

    Facebook X (Twitter)
    • Home
    • About us
    • Contact
    • Disclaimer
    • Privacy Policy
    © 2025 Marketsnews.co.uk

    Type above and press Enter to search. Press Esc to cancel.