
Bitcoin price is now above $70,000 per coin. The recent rally back toward local all-time highs has carried BTCUSD high enough to causes two important moving averages to form a “Golden Cross.” This signal has appeared twice since the bear market bottom and yielded significant results. Let’s take a look at the data and the most recent signal now that it has confirmed.
Bitcoin Daily Golden Cross: 50-Day And 200-Day Moving Averages
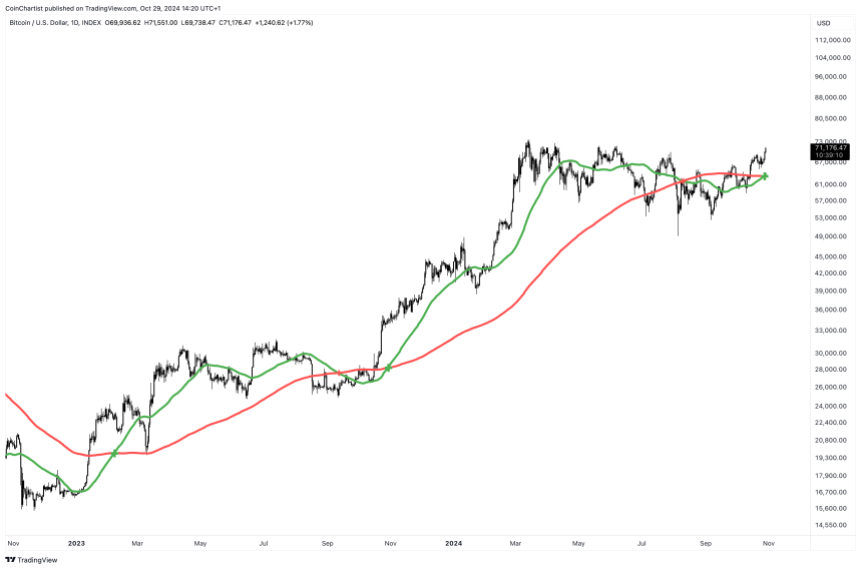
As pictured above, BTCUSD has triggered a daily golden cross of the 50-day and 200-day moving averages. In technical analysis, a golden cross happens when a short-term moving average crosses above a long-term moving average. This typically suggests that there is an actively trending environment and price is expected to appreciate.
Related Reading
The opposite, bearish signal is referred to as a death cross. The chart above also depicts a death cross in August 2024. However, its appearance didn’t lead to a prolonged downtrend. Could this also mean that this latest golden cross might not produce a sustainable uptrend?
BTCUSD Golden Cross And Death Cross Recent History
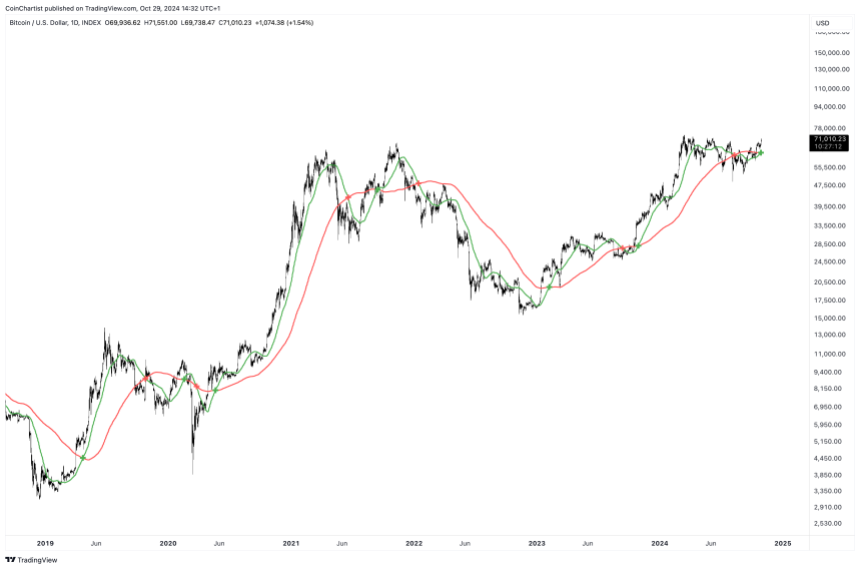
Zooming out provides a more clear picture of the signal’s effectiveness since the bear market bottom in November 2022. BTCUSD rising from bear market lows around $16,000 to $23,000 was enough to pull the 50-day moving average above the 200-day average, triggering the first golden cross of 2023.
This kept Bitcoin trending higher until it reached roughly $32,000, then fell to retest lows around $25,000. The bearish short-term price action then triggered a death cross. Here, much like we saw in 2024, Bitcoin trended sideways and avoided a downtrend. It didn’t take much upside to force another golden cross. From that golden cross, BTCUSD rallied another 100%, doubling in price.
The chart above shows that the golden cross in October 2024 occurred just months after the death cross, just like it did in late 2024. Could that mean another 100% rally from current levels? If so, Bitcoin price could reach as high as $140,000 before beginning to show weakness.
Buy And Hold: Using Moving Average Crosses As A Trading System
Using the 50-day and 200-day moving averages as a buy and hold trading system starting from 2018 would have yielded significant results. The first golden cross fired in April 2019 at around $5,000 per BTC. A death cross in October 2019 closed out the trade and sold some coins. A quick golden cross and death cross combo in early 2020 led to a small loss. May 2020’s golden cross more than made up for it, triggering when Bitcoin was trading just below $10,000.
The trade stayed open while Bitcoin blasted off into its most bullish trend in recent years and eventually closed with the next death cross in Jun 2021 at around $35,000 per BTC. This kept $25,000 in profit from the trade, combined with the initial $4,000 profit from the early 2019 trade to make $29,000. The small loss takes the total closer to $28,500.
Related Reading
In September 2021, BTCUSD golden crossed again at around $45,000, only to shortly later death cross at $3,000 lower. This death cross stayed active until Bitcoin shed another $30,000. Fortunately, using the two moving averages as a buy and hold trading system meant the death cross moved you to cash – avoiding the worst of the bear market.
Come early 2023, Bitcoin was ready to begin a new uptrend and the golden cross triggered at $23,000. A death cross formed at $27,000, keeping another $6,000 worth of profits. Another golden cross in October 2023 triggered at $35,000, riding all the way to $62,000 when the most recent death cross closed out the trade.
In six trades total, the 50/200MA trading system would have earned approximately $58,500 as Bitcoin traveled from around $5,000 to $74,000. Four out of the six trades were profitable and the two losses were relatively minor when compared to the profits generated.
Tony Severino, CMT is the author of the CoinChartist (VIP) newsletter. Sign up for free. Follow @TonyTheBullBTC & @coinchartist_io on Twitter. Or join the TonyTradesBTC Telegram for daily market insights and technical analysis education. Please note: Content is educational and should not be considered investment advice.
Featured image from ChatGPT, Charts from TradingView.com