Close Menu
    What's Hot

    We Let Grok 3 Trade Crypto — Here’s What Happened

    Maelstrom Announces Its Fourth Bitcoin Developer Grant Recipient

    Mercurity Fintech’s $800M Bitcoin treasury financing plan

    Facebook X (Twitter) Instagram
    MarketsNews.co.uk
    • Live Chart
    • Brokers
    • Scam Broker
    • Reviews
    • Tools
      • Lot Size Calculator
      • Margin Calculator
      • PIPS Calculator
      • Profit & loss calculator
    Facebook X (Twitter) Instagram
    Start Trading
    Trending Topics:
    • Markets
    • Stocks
    • Cryptocurrency
    • Forex
    • Scam Broker
    MarketsNews.co.uk
    • Markets
    • Stocks
    • Cryptocurrency
    • Forex
    • Scam Broker
    Cryptocurrency

    XRP $0.60 Triangle Breakout Could Ignite Parabolic Rally – Key Levels To Watch

    Anthony M. OrbisonBy Anthony M. OrbisonSeptember 23, 2024No Comments3 Mins Read
    Share Facebook Twitter Pinterest Copy Link Telegram LinkedIn Tumblr Email
    XRP 060 Triangle Breakout Could Ignite Parabolic Rally – Key
    XRP 060 Triangle Breakout Could Ignite Parabolic Rally – Key
    Share
    Facebook Twitter LinkedIn Pinterest Email

    Este artículo también está disponible en español.

    XRP trades at a pivotal moment after several days of volatile price action, sparking renewed optimism among investors. Some analysts believe that XRP is on the verge of breaking out from a massive 4-year bullish triangle pattern, which has served as an extended accumulation period. 

    Related Reading

    This technical formation has been steadily building up, and now XRP appears poised for a significant expansion phase. Following years of underperformance caused by the ongoing SEC lawsuit and broader economic uncertainty, the market is watching closely for a potential breakout. If XRP breaks through its current resistance levels, many expect a parabolic rally, potentially leading to new highs.

    Investors eagerly await confirmation of this move, viewing it as a crucial moment in XRP’s long-term market trajectory. As momentum builds, XRP’s next moves could define its performance in the coming months and its role in the broader crypto market. 

    XRP Price Action Suggests A Bullish Breakout 

    The entire crypto market has experienced a surge, with Bitcoin and many altcoins seeing double-digit percentage increases in price. This rally follows the Federal Reserve’s recent decision to cut interest rates by 50 bps, sparking optimism among investors who believe a new crypto bull run is on the horizon. XRP investors also feel optimistic, as analysts share promising insights suggesting positive performance in this cycle.

    Related Reading

    One prominent crypto analyst, Carl Runfelt, shared his technical analysis on X, highlighting the bullish triangle pattern that XRP has been forming since 2020. According to Runfelt, XRP could see explosive growth during this bull cycle, potentially going parabolic and rising by over 200% within weeks if the pattern breaks. The key level to watch is $0.60, which has acted as significant resistance in recent weeks.

    XRP bullish triangle formation is about to break. | Source: Carl Runefelt on X XRPUSDT chart on TradingView

    If XRP breaks above this critical price point, it could trigger a wave of “fear of missing out” (FOMO), driving substantial demand and pushing prices to new highs. Investors are closely watching this level, anticipating a breakout that could reshape XRP’s trajectory for the remainder of the cycle.

    Pivotal Liquidity Levels

    XRP is currently trading at $0.587, sitting at a crucial level that could ignite a massive rally for the altcoin. After surging 15% since early September, the price is testing the weekly 200 moving average (MA) at $0.609 as resistance, a level that has held XRP down since April. Breaking through this barrier is essential for bulls aiming to extend the rally.

    XRP trading below rhe 1W 200 MA.
    XRP is trading below the 1W 200 MA. | Source: XRPUSDT chart on TradingView

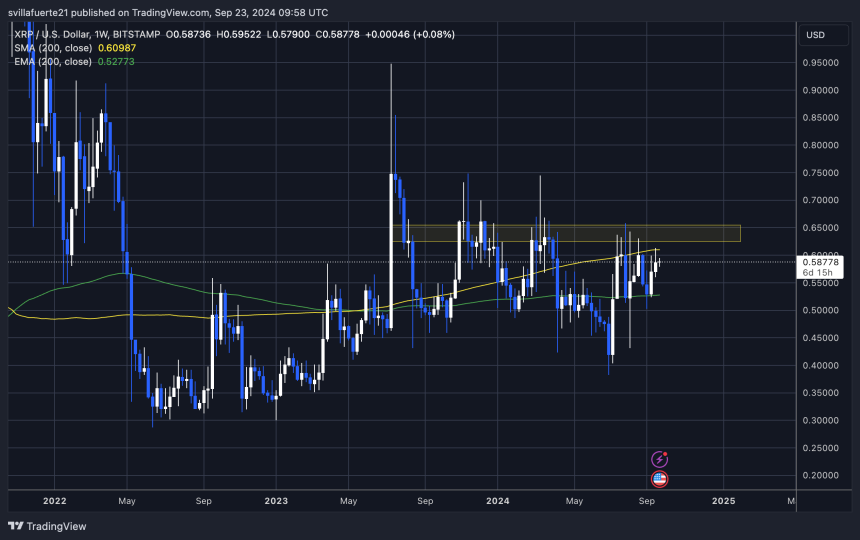
    XRP has reclaimed the weekly 200 exponential moving average (EMA) at $0.52, a strong demand zone since early July. This level will be key in holding up the price if a correction occurs.

    Related Reading

    For XRP to continue up, the price must break the $0.60 level and reclaim the 1W 200 MA as support. A clean break above these levels would signal the potential for a larger rally and a shift in market sentiment. However, failure to close above current levels could lead to more sideways consolidation or even a deeper pullback. In that scenario, XRP may retest the weekly 200 EMA at $0.52, which could work as a critical support level.

    Featured image from Dall-E, chart from TradingView

    Source link

    Share. Facebook Twitter Pinterest LinkedIn Tumblr Email Copy Link
    Previous Article5 Simple Forex Trading Strategies for Beginners
    Next Article Best Solar Stocks To Buy Now? 2 To Know
    Anthony M. Orbison
    • Website

    Related Posts

    We Let Grok 3 Trade Crypto — Here’s What Happened

    June 12, 2025

    Maelstrom Announces Its Fourth Bitcoin Developer Grant Recipient

    June 12, 2025

    Mercurity Fintech’s $800M Bitcoin treasury financing plan

    June 12, 2025
    Leave A Reply Cancel Reply

    Amazon.com, Inc.
    $212.33
    $0.87
    0.41%
    Meta Platforms, Inc.
    $688.93
    $5.22
    0.75%
    S&P 500
    $6,016.24
    $6.00
    0.10%
    Alphabet Inc.
    $176.62
    $2.17
    1.21%
    EUR/USD
    $1.16
    $0.0116
    1.01%
    EUR/JPY
    $166.18
    $0.184
    0.11%
    USD/CAD
    $1.36
    $0.0053
    0.39%

    Risk Disclosure: Trading in financial instruments and/or cryptocurrencies involves high risks including the risk of losing some, or all, of your investment amount, and may not be suitable for all investors. Prices of cryptocurrencies are extremely volatile and may be affected by external factors such as financial, regulatory or political events. Trading on margin increases the financial risks.
    Before deciding to trade in financial instrument or cryptocurrencies you should be fully informed of the risks and costs associated with trading the financial markets, carefully consider your investment objectives, level of experience, and risk appetite, and seek professional advice where needed.
    Fusion Media would like to remind you that the data contained in this website is not necessarily real-time nor accurate. The data and prices on the website are not necessarily provided by any market or exchange, but may be provided by market makers, and so prices may not be accurate and may differ from the actual price at any given market, meaning prices are indicative and not appropriate for trading purposes. Fusion Media and any provider of the data contained in this website will not accept liability for any loss or damage as a result of your trading, or your reliance on the information contained within this website.
    It is prohibited to use, store, reproduce, display, modify, transmit or distribute the data contained in this website without the explicit prior written permission of Fusion Media and/or the data provider. All intellectual property rights are reserved by the providers and/or the exchange providing the data contained in this website.
    Fusion Media may be compensated by the advertisers that appear on the website, based on your interaction with the advertisements or advertisers.
    We're social. Connect with us:

    Facebook X (Twitter)
    • Home
    • About us
    • Contact
    • Disclaimer
    • Privacy Policy
    © 2025 Marketsnews.co.uk

    Type above and press Enter to search. Press Esc to cancel.